It is well known that each U.S. state is unique in terms of the employment opportunities available. But it turns out that the types of jobs that are common in metropolitan areas also vary greatly, even between cities within the same state. We looked at data for 50 of the biggest cities in the U.S. to see which jobs are more common than the U.S. average. The results reveal many interesting trends and confirm some stereotypes about U.S. cities.
The U.S. Bureau of Labor Statistics (BLS) releases data that show the occupation with the highest Location Quotient (LQ) by metropolitan area. An LQ is a simple ratio used by the BLS to represent an areas distribution of employment by industry in comparison to the distribution in the U.S as a whole. An LQ greater than 1 indicates an industry with a greater share of the local area employment than in the U.S., while an LQ below 1 means a lower share than the average.
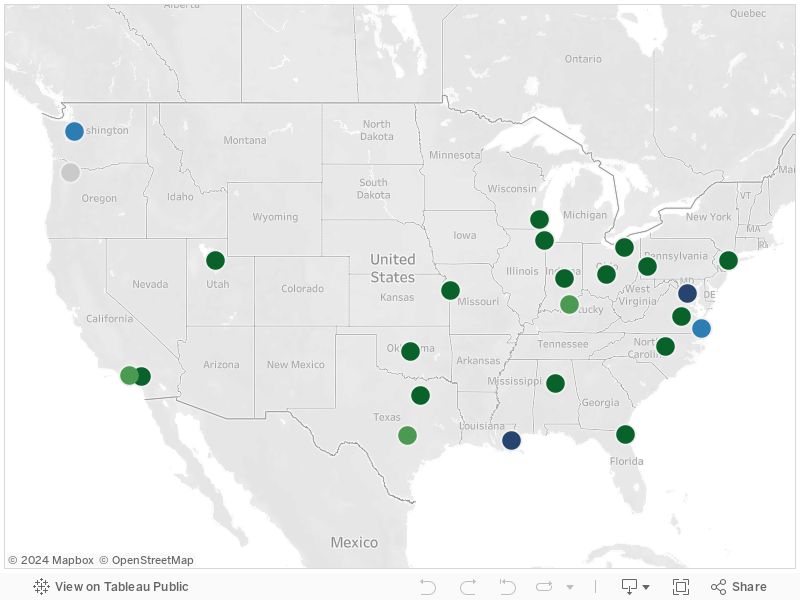
Five cities stand out from the rest with very high LQs. Las Vegas has 37 times more gaming supervisors than the national average, and New Orleans has 38 times more entertainers and performers than the average. Washington D.C. has 40 times more political scientists than the national average. No surprises there. The other blue spots on the map are Seattle, where there are 30 times more aircraft structure and systems assemblers than the average, and Virginia Beach, where there are 26 times more ship engineers than average. This is mainly due to the presence of companies like Boeing in Seattle and U.S. military and commercial shipyards in Virginia.
On the west coast there are some not-so-surprising trends, with the prevalence of semiconductor processors in Portland and Phoenix, and computer hardware engineers in San Jose. Interestingly though, California is also a hotspot for scientists, with anthropologists and archaeologists focused in Sacramento, microbiologists in San Francisco, and biochemists and biophysicists in San Diego. But in Los Angeles, show business rules, with 13 times more than the average level of media and communications workers.
Moving east, there is an unusually high concentration of geographers and geoscientists in Salt Lake City and Denver. In the southern U.S. there are clusters of professionals involved in the petroleum industry, with the notable exceptions of Austin, which has a large proportion of semiconductor processors, and San Antonio with credit authorizers. Over in Florida there is a very high concentration of entertainers and performers (in Orlando) and motorboat operators in Tampa and Miami. Strangely, Birmingham and Atlanta have a far greater-than-average proportion of schoolteachers, with biological science teachers standing out in Birmingham.
In the Midwest, there are some very interesting results. For example, Kansas City is a hub for sporting officials, Cincinnati and Detroit a hotspot for model makers (an important function for the auto industry), Indianapolis has a concentration of nurse midwives, Pittsburgh has a high percentage of gas pumping station operators (perhaps self-service has not caught on there), and Nashville is home to a large number of managers for artists, performers, and athletes (likely due to the country music industry and the presence of a number of professional sports teams despite a small population of only 600,000).
Based on the data, you could summarize life on the east coast as fashion, finance, and the rule of law. If you are looking for high fashion, look no further than New York City. The data confirm that New York is indeed the fashion capital of the U.S. If you are more interested in business than in fashion, an actuary in Hartford will be happy to assess your financial risk. But, if you have improperly assessed your risk and end up in court, you might find yourself in Baltimore, where court reporters are in ample supply.
Sign up below for a future update from Fixr on the release of its super-detailed cost of living analysis, based on geography and demographics.