The suburban house with a white picket fence might still be a part of the American Dream, but some people reaching first-homebuyer age are finding that it’s now more of a pipe dream. The last two decades have brought a rollercoaster of housing prices, mortgage rates, and availability, with data from the U.S. Census Bureau grouped into distinct eras of rapid appreciation separated by a market crash that’s still affecting today’s market.
There’s no better way to prepare for the future than to learn from the past. Unfortunately, the official Price Indexes of New Single-Family Houses Sold Including Lot Value data suggest that we may be headed into uncharted territory. What we’re seeing in the housing market now is more of a crisis of scarcity and cost rather than reckless lending practices.
We spoke with leading economists to understand current trends and what the housing market may hold in the coming years:
Dr. Selma Hepp, Chief Economist at Cotality
Cris de Ritis, Deputy Chief Economist at Moody's Analytics
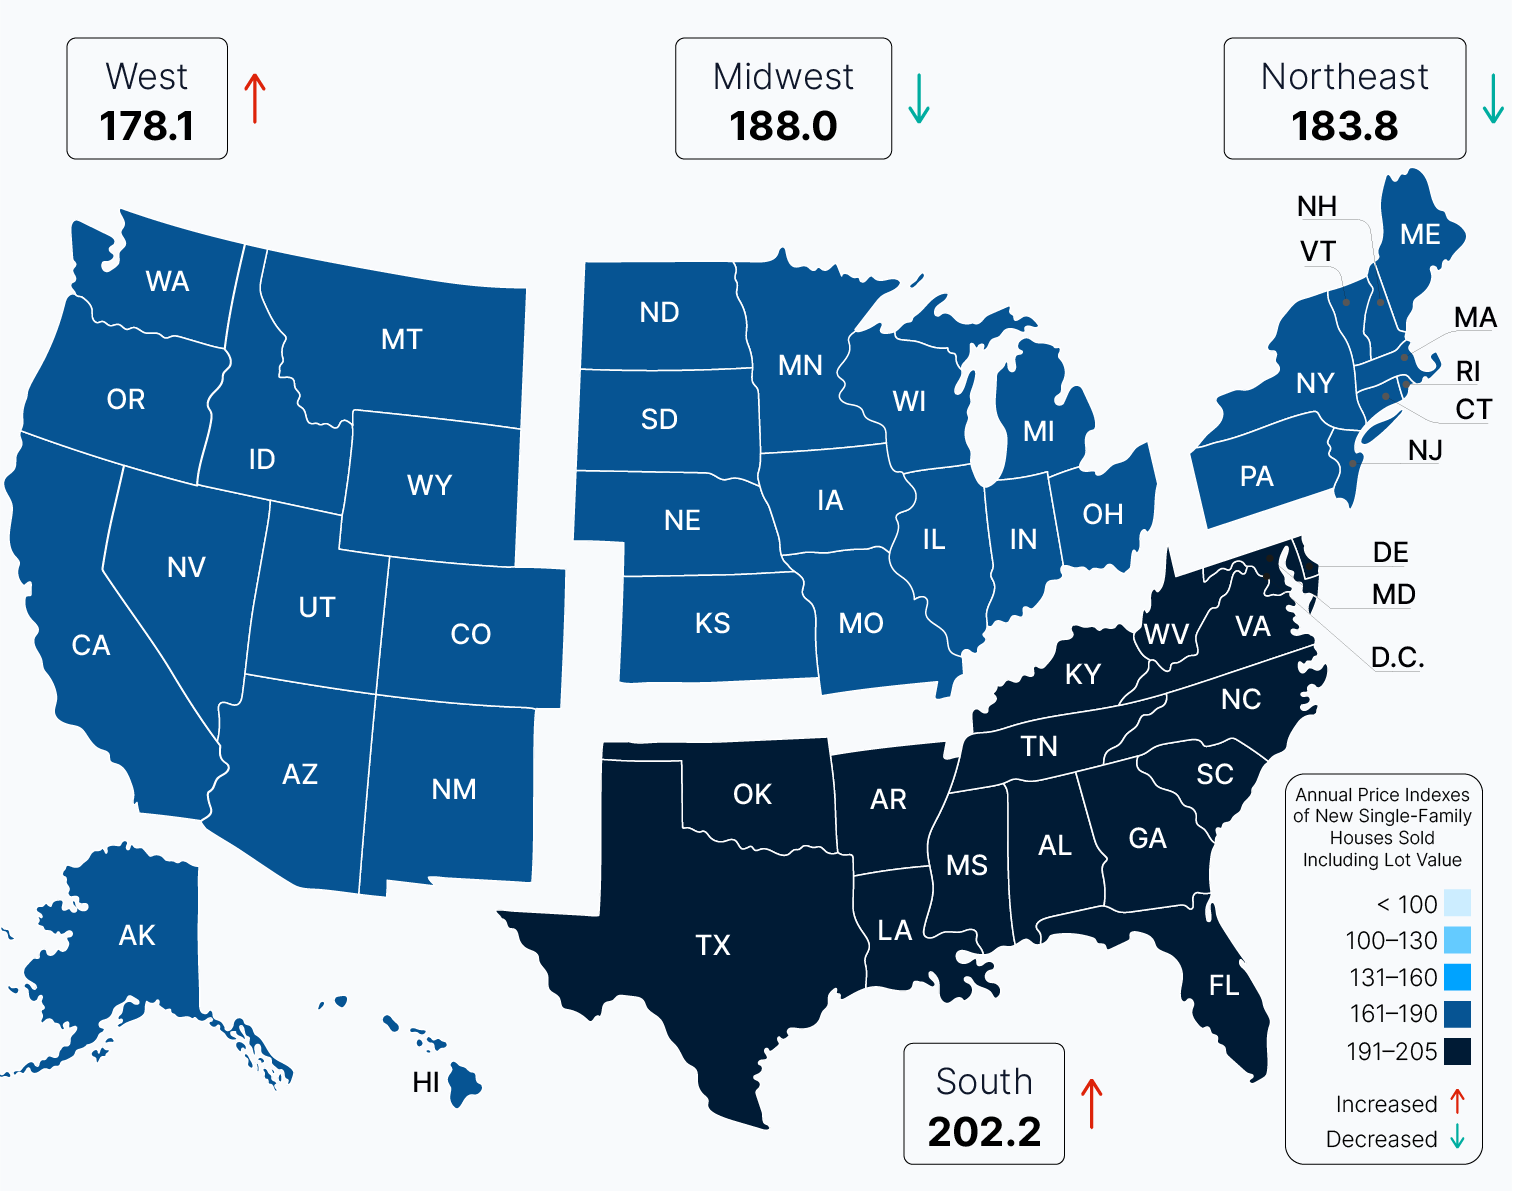
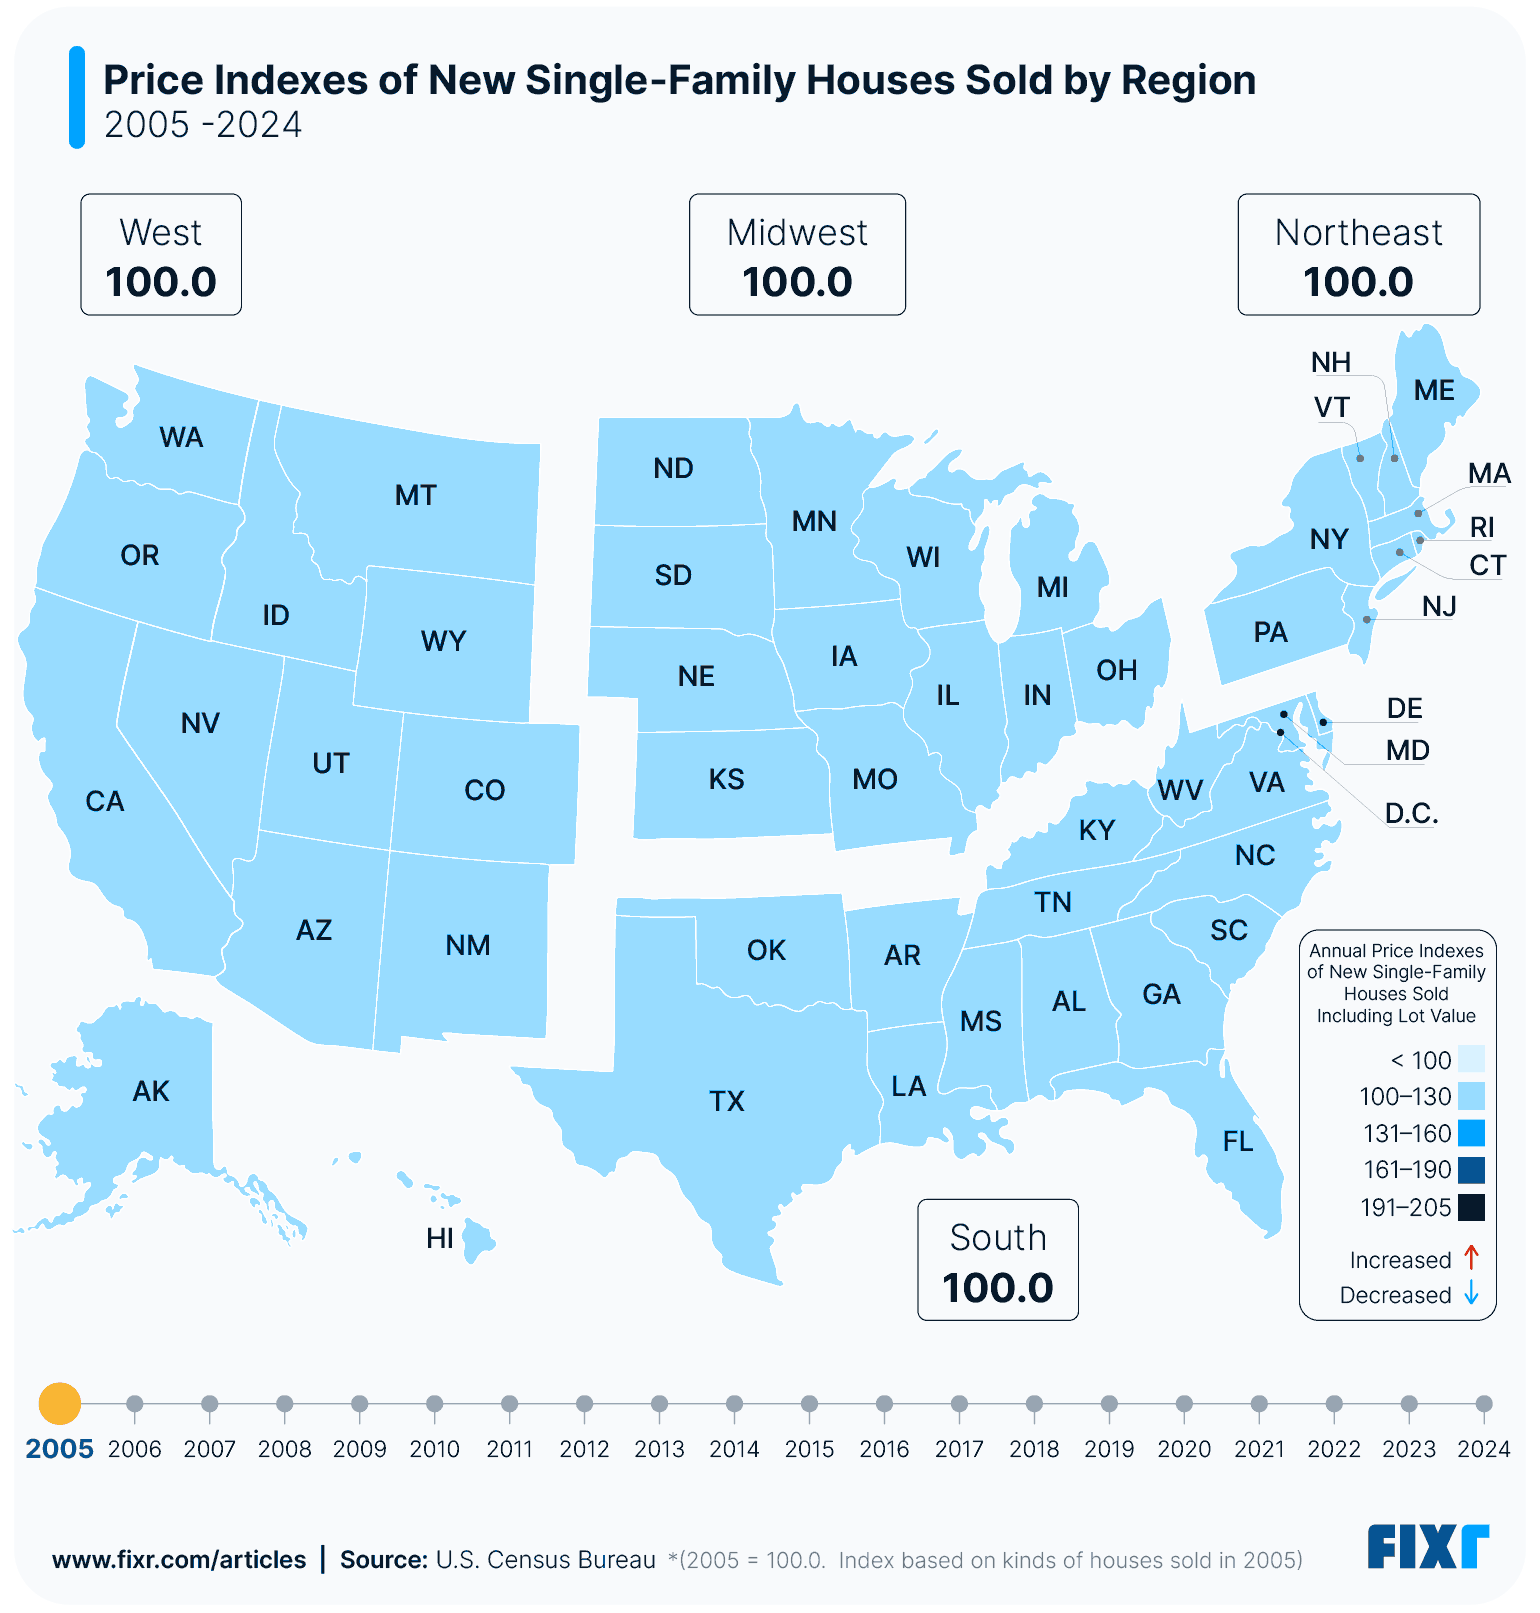
The Price Index of New Single-Family Houses Sold Including Lot Value comes from the Census Bureau and tracks changes in sales prices of new construction, including land value. We used the data to look at how housing costs have changed in the last two decades, with each year being compared to 2005 prices. For example, an index value of 150 means new construction homes cost 50% more than in 2005.
Key takeaways:
The average home value in 2024 was 92% higher than it was in 2005 across the U.S.
The only years housing prices across the U.S. dipped below values in 2005 were from 2008 through 2012, after the housing market crash.
Experts agree that another downturn is coming, but persistently high mortgage rates and trailing income increases could mean an even worse dip than in 2008.
The Complete History of U.S. Home Prices (2005-2024)
The housing market is remarkably complex, with everything from basic supply and demand to things like immigration, income increases, and the cost of living affecting prices and affordability. While predicting the market is impossible, understanding the history of the market can help prepare us for what’s to come.
Year | West | Midwest | Northeast | South |
2005 | 100 | 100 | 100 | 100 |
2006 | 105.2 | 102.9 | 102.6 | 105.4 |
2007 | 102.6 | 102.8 | 101.5 | 107.5 |
2008 | 92.7 | 98.9 | 100.8 | 103.7 |
2009 | 84.8 | 96 | 97.1 | 101.1 |
2010 | 85.4 | 96.9 | 101.1 | 99.5 |
2011 | 83.2 | 97.8 | 100 | 99.6 |
2012 | 86.3 | 101.6 | 102.1 | 102.7 |
2013 | 94.7 | 105.3 | 108.2 | 110.2 |
2014 | 99.5 | 112.6 | 115.2 | 115.4 |
2015 | 101.9 | 116.4 | 115.7 | 118.3 |
2016 | 113.3 | 118.7 | 121.1 | 125.1 |
2017 | 117.9 | 126.5 | 130.5 | 131.9 |
2018 | 128.9 | 128.9 | 127.6 | 136.2 |
2019 | 127.5 | 134.1 | 127.7 | 141.9 |
2020 | 133 | 141.3 | 136 | 145.8 |
2021 | 157.3 | 159.9 | 152 | 166.4 |
2022 | 176.4 | 182.6 | 168.9 | 194.3 |
2023 | 165.1 | 188.2 | 192.1 | 198.9 |
2024 | 178.1 | 188 | 183.8 | 202.2 |
The past 20 years show that shocks—whether financial, pandemic, or inflationary—can rapidly alter housing dynamics.

2005–2008: The Housing Bubble Peak
One of the most famous shocks to the housing market was the market crash of 2008, but that really started a few years earlier, in 2005. Homes saw rapid appreciation from 2005 through 2007, in large part because of low mortgage rates and income growth. Value increases were uneven during the bubble years, with Western and Southern regions rising the fastest. Those prices began to plateau in 2007, which was the first sign of instability.
In early 2008, values began to dip, which was the start of the downturn. Value dips don’t always predate a catastrophe, but this one did for several reasons.
“Back then, vulnerability came from both oversupply, as construction outpaced household formations, and low-quality underwriting, as overleveraged, poorly underwritten credit flowed to marginal borrowers,“ said de Ritis.
2008–2012: The Crash and Decline
By late 2008, new construction had slowed to a crawl as demand plummeted and values fell. Tightened lending practices meant lower affordability, and many homeowners found themselves locked into homes they couldn’t afford. As a result, foreclosure rates rose to unprecedented levels.
The bottom of the collapse came in 2011, which brought with it the lowest home values since before the dip. Western markets saw the steepest drops, but all regions dipped before we saw early recovery signals in 2012.
2012–2020: Gradual Recovery
The market as a whole was much more conservative after the crash. Slower construction rates, gradual job recovery, and declining mortgage rates all contributed to rising demand, and values rose right alongside it. By the mid-2010s, the West led the national recovery, with the South following closely behind.
Eventually, new inventory rates picked up, but the lag in construction was creating higher and higher demand. This helped contribute to another massive shock to the market during the pandemic.
2020–2025: Pandemic and Inflation Effects
As remote work became the norm during the pandemic, buyers were no longer tied to living close to their workplace and could expand their housing searches further afield. This shift, combined with the migration away from major cities and heavily congested areas, meant disparate changes to housing availability and unusual volatility in pricing.
When combined with historically low mortgage rates and construction supply chain disruptions that slowed new inventory, it’s easy to see how the pandemic shook the housing market at its core. The South and West saw the most pronounced pandemic-era price spikes, but all regions soared. Following the surge in property values, the market cooled a bit.
“We have an undersupply of housing due to low levels of construction over the past decade, and high levels of homeowners' equity, given larger down payments and rapid house price appreciation over the past five years,” said de Ritis. “In addition, mortgaged homeowners, overall, have a much stronger financial profile due to high lending standards implemented in the wake of the housing crash.”
To this day, post-pandemic prices have leveled out. “A weak labor market, low income growth, and persistently high mortgage rates could weigh on affordability, reducing transaction volumes and resulting in lower turnover,” added de Ritis. “House prices may not crash in this scenario, but they could remain weak for an extended period.”
Expert Perspective: Current Housing Market Trends and Challenges
What worries me more than a 2008-style crash is a slow squeeze scenario where homeowners are locked into their homes by interest rates and capital gains taxes, thereby reducing the supply of existing homes for sale.

So, what does this brief history tell us about the future of real estate prices in the U.S.? There are a few key similarities to the 2008 crash that can lead to some conclusions, but there are also some factors that make our current situation unique.
Supply and Demand-Driven Price Hikes
Supply and demand are always going to be key factors in any market, but when it comes to housing, there are many outside forces at play that can have an impact on both.
“Supply constraints remain a dominant factor,” said Hepp. “Labor shortages, elevated construction costs, and restrictive zoning have kept new-home inventory tight. Lot values have also surged, especially in land-constrained metros. Demand-side pressures amplified during the pandemic—historically low mortgage rates, remote work flexibility, and demographic tailwinds (millennials entering prime buying years) fueled strong demand. However, post-2022, higher mortgage rates cooled demand, but persistent supply limitations have prevented significant price corrections. So, while demand has softened, the structural supply shortage keeps prices elevated.”
Policy Failures Putting Pressure on the Market
Foreign and domestic policy play crucial roles in housing supply and affordability, but experts agree that the policy failures today are different from those that contributed to the 2008 crash.
“We're more exposed to Federal Reserve monetary policy errors in either direction, and to the fallout of trade and immigration policies, than we are to subprime lending practices” says de Ritis. “This is where I think we're seeing the most consequential - yet underappreciated - policy failures:
Federal level:
The 1997 Taxpayer Relief Act's $250k/$500k exclusion on capital gains taxes has become distortionary. Unchanged since its implementation, millions of homeowners would now face a significant capital gains tax bill if they were to sell their homes. This creates significant lock-in for anyone who's owned their home for a long time
Uncertainty around the direction of Federal Reserve policy can have a chilling effect on decision-making
Banking regulations post-2008 reduced the construction lending appetite, particularly for smaller builders
Tariff policy increases the cost of construction materials, such as steel, copper, aluminum, lumber, and gypsum, as well as appliances, fixtures, and other finished goods
Immigration policies affect the availability and cost of labor, with foreign-born workers playing a dominant role in some markets
Local/State level:
Zoning remains the most consequential barrier to housing development. Land values in constrained markets often reflect policy-created scarcity more than inherent scarcity
Impact fees, development charges, and other regulatory costs represent as much as 25% of new home costs in many markets (according to the NAHB)
The political economy creates perverse incentives: existing homeowners benefit from supply constraints through asset appreciation, creating opposition to policies that would improve affordability”
“The interaction between these levels is also important,” continued de Ritis. “Federal policy and lending regulations cannot address local supply constraints, but local zoning changes will not be effective if credit conditions are too tight or interest rates are high.
Expert Outlook for the Housing Market: Predictions, Risks and Regional Trends
The current dynamics follow significant dislocation in the housing market, and thus the recovery will take similarly as long as it did post- 2010 period.
-Hepp
De Ritis and Hepp narrowed down some of the major factors at play that could influence U.S. home prices in the coming years.
What Could Slow or Reverse Home Price Appreciation
Based on de Ritis’s modeling work, there are a few potential triggers that could lead to appreciation slowing or even reversing.
Most likely to cause deceleration:
A sustained increase in unemployment stemming from either a slowdown in overall economic activity or the adoption of labor-saving technologies, such as artificial intelligence
Mortgage rates staying elevated for another 2–3 years, putting continued pressure on affordability
Persistent inflation, which erodes living standards and makes it difficult for borrowers to save for down payments
Would cause an outright reversal:
Deep recession with unemployment spiking to 6–7%+
Forced selling due to financial stress.
Why Prices Are Hard to Bring Down
Even in scenarios where demand cools, several factors can still strip supply and continue to prevent widespread price declines.
According to de Ritis, “80% of mortgaged homeowners have sub-6% interest rate mortgages. This, plus capital gains considerations, creates what I call a ‘dual lock-in effect.’ This is a stabilizer against crash scenarios, as these homeowners have strong balance sheets, relatively low monthly mortgage payments, and little motivation to sell under duress.”
De Ritis explained some difficulties with overcoming that strong lock-in effect:
“The challenge is that most scenarios that would reduce prices significantly would require breaking the lock-in effect, which increasingly means either:
Time passes (i.e., waiting for life events such as changes in family composition to force selling)
Economic pain severe enough to force selling from homeowners who need to downsize to reduce their financial obligations and/or avoid default.”
Why Affordability Remains the Central Risk
According to Hepp, affordability remains the primary issue for the future of the housing market.
“Even if prices plateau, elevated mortgage rates and income stagnation mean affordability will remain the central challenge for buyers and policymakers for years to come,” said Hepp. “Alternative mortgage products that we are talking about now (such as the 50-year mortgage) are similar to what we did leading up to the GFC (global financial crisis) in order to relieve the affordability crisis. They will generally only have a limited impact and will increase credit and borrow risk to investors. However, coming out of the GFC, the drop in home prices resolved the affordability crisis. This is an unlikely scenario this time around, as new construction has lagged for over a decade, so the undersupply remains the key challenge.”
What Regional Trends Should Buyers and Builders Be Watching
Regional trends have cropped up all throughout the price and affordability swings over the past two decades, and they’ll continue to shape how markets behave going forward. Hepp explained what trends we’re likely to see:
Sun Belt metros (Austin, Phoenix, Tampa, Atlanta) saw outsized pandemic-era gains and remain relatively expensive compared to pre-2020 trends. Builders here should watch for affordability ceilings and slower absorption rates.
Mountain West (Boise, Salt Lake City) experienced rapid appreciation but is now seeing more pronounced corrections as migration patterns normalize.
Coastal markets (California, Northeast) still face severe supply constraints, but demand is highly sensitive to rates—expect slower price growth and longer sales cycles.
The Midwest remains a relative affordability haven, attracting buyers priced out of coastal and Sun Belt markets.
“Overall, migration-driven demand is stabilizing, but local job growth, job mix, and wealth effects, as well as housing policy, will dictate future resilience,” continued Hepp.
Bottom Line
If the housing industry has taught us one thing over the past 20 years, it’s that you can’t always predict where the market is headed. But understanding how different factors have influenced pricing in the past can help predict the role of mortgage rates, price spikes, unemployment, lending practices, and more for the future.
Experts agree that what’s happening with the housing market now has some similarities to the housing market crash of 2008. However, persistently high mortgage rates, tighter lending practices, and disparate income-to-housing-cost ratios mean that new loan products, like 50-year mortgages, may become not only the norm but also the necessity as affordability remains historically low.
Data and Methodology
This analysis uses the Price Indexes of New Single-Family Houses Sold Including Lot Value by region, with 2005 set as the baseline (2005 = 100).
The data for this analysis comes from the U.S. Census Bureau and the U.S. Department of Housing and Urban Development (HUD), drawn from the Survey of Construction. All price indexes are presented relative to 2005, which serves as the baseline year for comparison. Regional breakdowns cover the West, Midwest, Northeast, and South, allowing for comparisons of trends across the United States. Insights from economy experts Dr. Selma Hepp and Cris de Ritis are used to interpret the trends and provide context.
Irena is an industry analyst and content specialist at Fixr.com, where she transforms complex data into clear insights that help readers make smarter financial decisions. She holds a degree in Economics and has been conducting personal finance research since 2018, bringing a strong analytical foundation to her work. Her insights have been featured in reputable outlets such as the Washington Examiner, Yahoo Finance, Fox40, and Forbes.