
The construction industry and specifically the housing construction industry has come a long way in the last 30 years. Thanks to the scientific development of building materials and advancements in building technology, faults or deficiencies in building standards have largely been addressed. Focus has also turned to ensure that modern buildings are completed following strict environmental codes. As a result, the built environment has improved thanks to these advancements, making housing safer and more environmentally friendly than ever before.
However, if the majority of houses available in the housing market are 30 years or older, the benefits of these advancements can't be experienced. In order to ensure the housing market not only meets current day demands but also safety standards, an increase of new builds is urgently necessary.
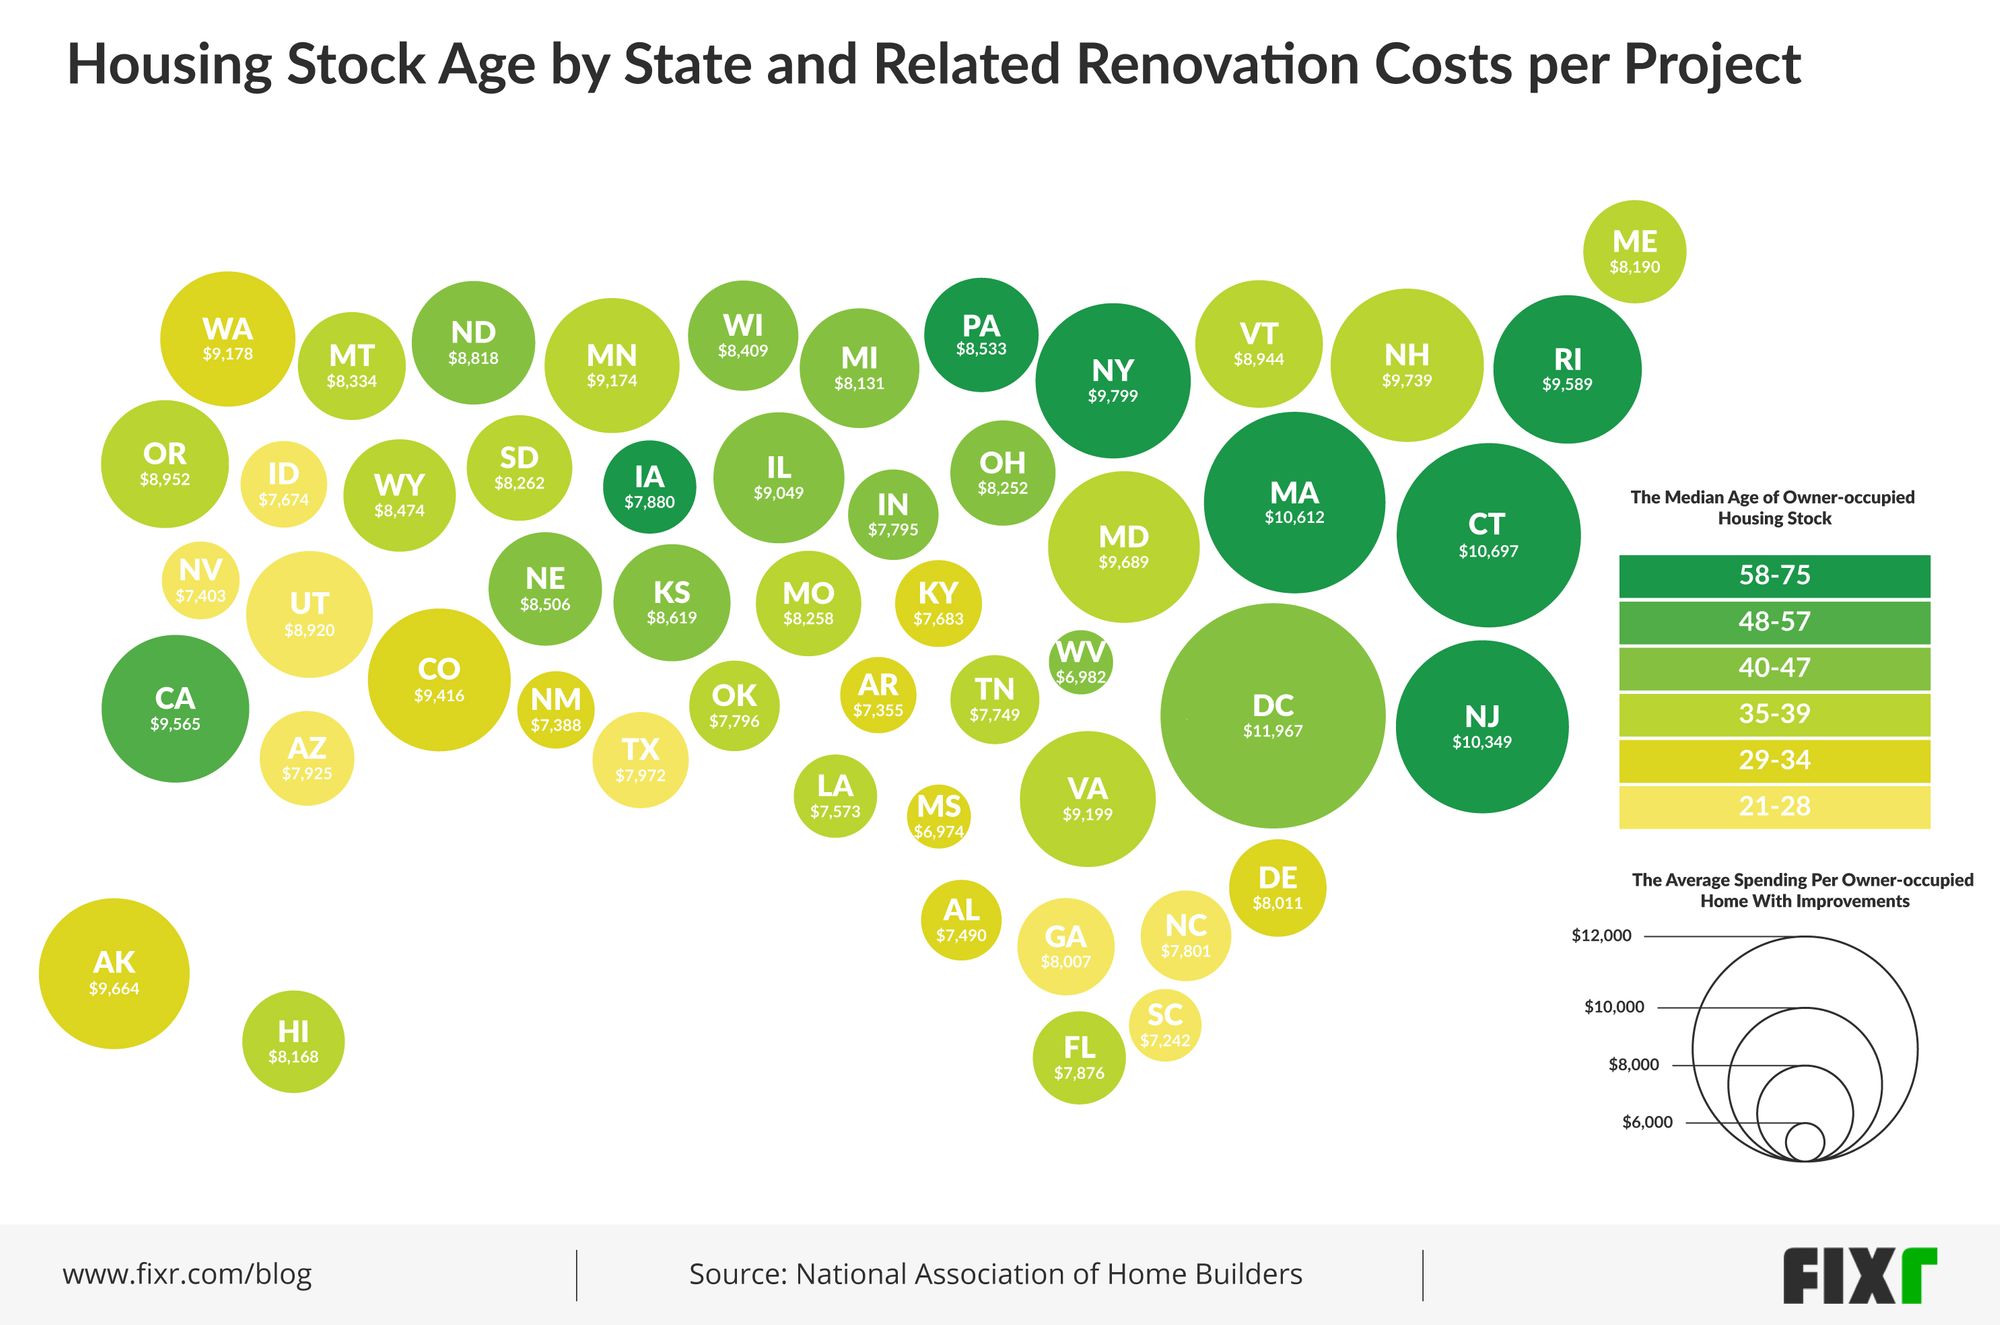
A Look at the Age and Renovation Numbers
The above graph was compiled using data from the American Community Survey(ACS) with regard to the median age of housing stock in the U.S.A. and the NAHB's estimates regarding Spending Per Owner-Occupied Home, With Improvements 2018. The data focused on housing stock aged between 21 and 75 years old, while spending indicated shows the average cost of home improvements per completed project.
Of the states, only 8 had an average housing age of 21-28 years, namely Utah, Georgia, Texas, Arizona, North Carolina, Idaho, Nevada, and South Carolina. The nine states with a median housing stock age of 29-34 were Alaska, Colorado, Washington, Delaware, Kentucky, Alabama, New Mexico, Arkansas, and Mississippi.
The majority of states had a median housing stock age of 35-39 years. They included New Hampshire, Maryland, Virginia, Minnesota, Oregon, Vermont, Wyoming, Montana, South Dakota, Missouri, Maine, Hawaii, Florida, Oklahoma, Tenessee, and Louisiana. Ten fell into the bracket with 40-47 year-old houses, namely District of Colombia, Illinois, North Dakota, Kansas, Nebraska, Wisconsin, Ohio, Michigan, Indiana, and West Virginia. California was the only state with a median housing stock age of 48-57. And the final category of houses between the age of 58 and 75 included only seven states, namely Connecticut, Massachusetts, New Jersey, New York, Rhode Island, Pennsylvania, and Iowa.
Average spending per improvement was largely directly proportionate, with the older homes linked to higher spending and the newer homes, the opposite. States that spent the least ($6,000-$7,999) were Mississippi, West Virginia, South Carolina, Arkansas, New Mexico, Nevada, Alabama, Louisiana, Idaho, Kentucky, Tennessee, Indiana, Oklahoma, North Carolina, Florida, Iowa, Arizona, and Texas.
The largest proportion of states fell into the bracket of spending an average of $8,000 to $9,999 and included Giorgia, Delaware, Michigan, Hawaii, Maine, Ohio, Missouri, South Dakota, Montana, Wisconsin, Wyoming, Nebraska, Pennsylvania, Kansas, North Dakota, Utah, Vermont, Oregon, Illinois, Minnesota, Washington, Virginia, Colorado, California, Rhode Island, Alaska, Maryland, New Hampshire and New York. The final bracket included states that spent an average of $10,000-$12,000 per renovation and included only New Jersey, Massachusetts, Connecticut and District of Columbia (which had the highest spend of $11,967)
How Housing Ages and Renovation Costs Affect You
The spread of newer houses to older houses definitely seems to follow a pattern that may be explained by the current population and employment growth rates, in the respective states. The central and southwestern states have taken the lead regarding population growth, with Nevada and Utah leading the pack at 1.95% and 2.03% respectively, according to NAHB. Accordingly, they also fall into the bracket with newest houses, as well as the lowest spend for renovations at $7,403 and $8,920 respectively.
Given that older houses tend to require more repair, it can be deduced that the states with the older houses will require more renovation projects in time. This would particularly apply to the more northeastern states as seen with New York, New Jersey, Massachusetts, and Connecticut in the graphic. We can see that their current spend is the highest in the country, and they also have the oldest average housing stock age.
While older houses are only required to meet the codes that were in place at the time of their construction, any renovations that are made to these homes will be required to meet the current-day codes, which could lead to more costly renovations as well. That said, building to code doesn't necessarily imply quality workmanship, so even newer houses that meet building codes could require repair/replacement of work. This suggests newer homes are not free from the risk of repeated repairs, especially if the work is not completed by a registered professional.
How homeowners can move forward
These figures show certain trends regarding the cost of renovations as well as the likelihood of homeowners in each state needing to carry out renovations for repair (that are age-related). There are several things to do as a homeowner to help avoid costly repairs and renovations.
When buying the house, make sure it meets all local building codes as required by the local municipality, whether it is a new or old house. Ask your local municipality for any building permits that have been obtained for the house that would cover prior renovations. Keep in mind that many municipalities don't officially follow set building codes and that codes mostly refer to safety issues regarding fire, energy consumption, etc., so poor workmanship can still pass code requirements.
Also, ensure you hire professional contractors who are registered with their relevant associations to complete major renovation projects, to avoid health and safety issues that may not be covered by your local building codes.
Finally, new and old houses each have their own benefits. This graphic should give you an indication of the type of housing you're likely to find in your area and what kind of costs you will incur, should you wish to renovate. Keep in mind these are working on median figures, so it is always wise to get quotes from several local contractors to ascertain a more specific costing estimate.