
When talking about economic performance, there are certain sectors that are fairly good indicators of what a country has to look forward to. The construction industry is one such example. For instance, when a country sees a boom in commercial construction, there is often a correlation in business growth, and with that, job opportunities. The same goes for a leap in warehouse building indicating that that industry has seen some growth. However, when we look to individuals, a focus on residential construction can show how members of the population are feeling about their country in terms of confidence, solvency, and desirability of geographic location.
Here, we take a look at the number of total building permits for new, privately-owned housing units by metropolitan area, to get a better idea of the state of residential construction, and the economy.
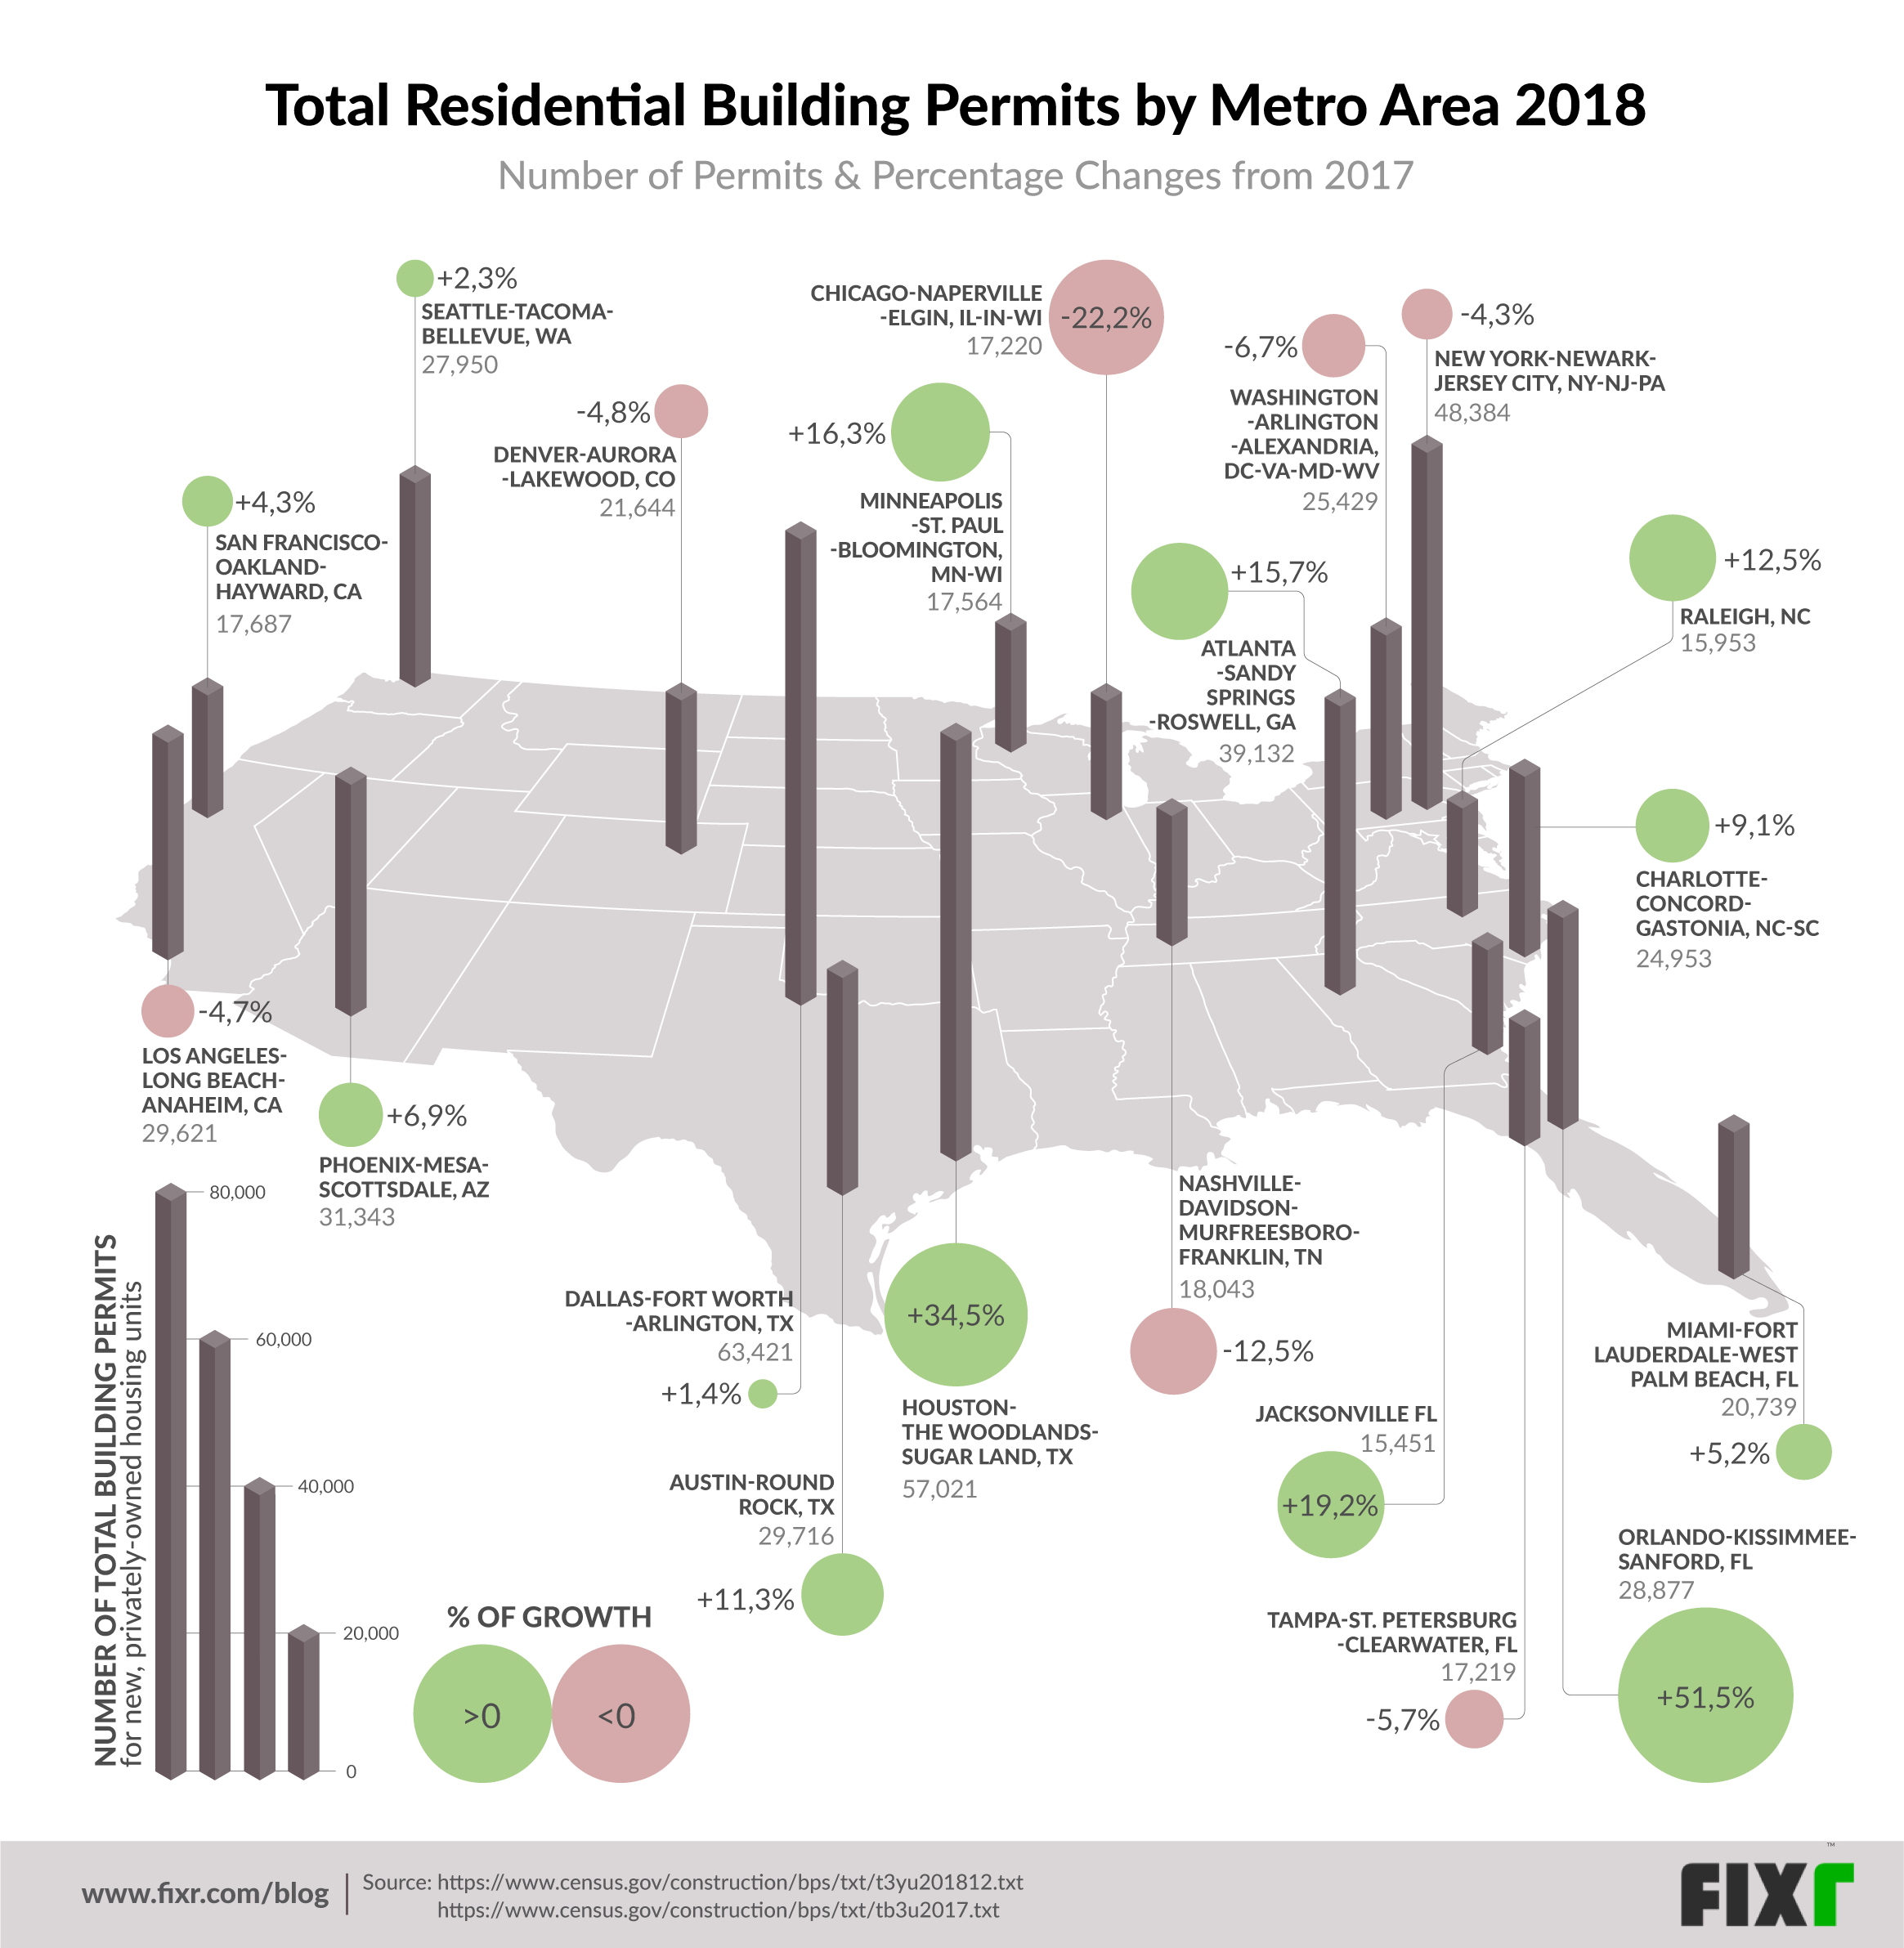
Though the exact positions of the top ten spots have changed somewhat between 2017 and 2018, the same ten metro areas top the list, with one exception. Orlando-Kissimmee-Sanford, FL jumped from 15th position to 8th, displacing Charlotte-Concord-Gastonia, NC-SC to 11th place. This was achieved thanks to a huge 51.5% increase in permits issued for the metro area, from 19,065 in 2017, to 28,877 in 2018.
| Top 20 Metros with the Most Building Permits in 2018 | Number of Building Permits | Change from 2017 |
| 1. Dallas-Fort Worth-Arlington, TX | 63,421 | +1.43% |
| 2. Houston-The Woodlands-Sugar Land, TX | 57,021 | +34.5% |
| 3. New York-Newark-Jersey City, NY-NJ-PA | 48,384 | -4.3% |
| 4. Atlanta-Sandy Springs-Roswell, GA | 39,132 | +15.7% |
| 5. Phoenix-Mesa-Scottsdale, AZ | 31,343 | +6.9% |
| 6. Austin-Round Rock, TX | 29,716 | +11.3% |
| 7. Los Angeles-Long Beach-Anaheim, CA | 29,621 | -4.7% |
| 8. Orlando-Kissimmee-Sanford, FL | 28,877 | +51.5% |
| 9. Seattle-Tacoma-Bellevue, WA | 27,950 | +2.3% |
| 10. Washington-Arlington-Alexandria, DC-VA-MD-WV | 25,429 | -6.7% |
| 11. Charlotte-Concord-Gastonia, NC-SC | 24,953 | +9.1% |
| 12. Denver-Aurora-Lakewood, CO | 21,644 | -4.8% |
| 13. Miami-Fort Lauderdale-West Palm Beach, FL | 20,739 | +5.2% |
| 14. Nashville-Davidson--Murfreesboro--Franklin, TN | 18,043 | -12.5% |
| 15. San Francisco-Oakland-Hayward, CA | 17,687 | +4.3% |
| 16. Minneapolis-St. Paul-Bloomington, MN-WI | 17,564 | +16.3% |
| 17. Chicago-Naperville-Elgin, IL-IN-WI | 17,220 | -22.2% |
| 18. Tampa-St. Petersburg-Clearwater, FL | 17,219 | -5.7% |
| 19. Raleigh, NC | 15,953 | +12.5% |
| 20. Jacksonville FL | 15,451 | +19.2% |
It is important to note that 7 of the top 20 metro areas above actually had a decrease in permits issued. However, due to population size and related building requirements, their total permits are still in great enough numbers to top the list of over 360 metro areas counted. Of the top 20, New York-Newark-Jersey City, NY-NJ-PA and Los Angeles-Long Beach-Anaheim, CA both made it into the top ten above, despite their permits dropping by 3,657 collectively.
Tampa-St. Petersburg-Clearwater, FL, and Washington-Arlington-Alexandria, DC-VA-MD-WV made it into the top 20 despite decreases in permits of 1,049 and 1,836 respectively. However, the two metro areas that had the greatest decreases in building permits were Nashville- Davidson- Murfreesboro--Franklin TN which dropped by 2,588 and Chicago-Naperville-Elgin, IL-IN-W which dropped by nearly double that by 4,912.
What is significant is that looking at Chicago-Naperville-Elgin's drop of 22.19 %, compared to New York-Newark-Jersey City's drop of 4.34 %, the percentages imply a difference of nearly five times the lower rate, however, the actual numeric difference is only 2,718 permits (which is only about twice the lower rate). This highlights the fact that it is important to look at the metro area's size to get a clear understanding of the changes indicated.
A look at the figures in layman's terms
By looking at changes in population numbers by metro area (also from the U.S Census Bureau), changes in the national employment rates and even weather patterns we can infer why these states are leading the pack in terms of new builds.
Considering the two metro areas with the highest percentage increase - Orlando- Kissimmee- Sanford, FL (51,47%) and Houston-The Woodlands-Sugar Land, TX (34,50%) - we get an idea of the variety of forces driving the boom in demand for permits. In Florida, the increase in demand for residential housing seems to stem from increased demand from both professionals (thanks to a spike in medical and tech jobs) and retirees, as well as those trying to avoid the higher costs of living, and cold in the northeast, specifically NY. Whereas Hurricane Harvey seems to have been the main driver for new residential development in Texas, with homeowners choosing to rebuild homes in better positions. That said, growth in the oil and gas industries means that demand is also coming from employment nomads, again, mostly coming from NY.
In contrast, powerhouses like New York, LA and Chicago only made it to the top ten thanks to their sheer population size and density requiring housing. The -4,34% drop in demand of New York-Newark-Jersey City, NY-NJ-PA, however, indicates that size is not enough to maintain this growth. With the more recently developed boom towns offering a better quality and cost of living, and cheaper housing, these 'original greats' are losing some of their luster.
Keeping up with the evolving demand for residential construction
13 of the top 20 metropolitan areas listed above reported positive growth in new residential building permits issued. However, looking at the demand for permits across the country, over the last 10 years there has been a downward trend from the high of 32,94% in 2012, ending at a fairly unimpressive, overall increase in permits, of only 2.80% in 2018.
This, coupled with the development of new markets, is creating demand for construction in unexpected places, indicating that that demand will not be as predictable as in the past. New areas of growth in the country such as alternative energy will mean that the potential for increased demand is no longer limited to two or three major metropolitan centers, but is rather spreading out as the population reaches its limit for high costs of living and housing prices.
While in the past, following economic trends and job and industry developments was the domain of economists and bankers, the construction industry could do well to keep an eye on these trends going forward. Knowing the 'migratory' patterns of the population will help predict where construction demand will hit next, providing lucrative and continuing opportunities across the board.