
Executive Summary
California HVAC is entering a structural growth cycle unlike anything the industry has seen in decades. Three forces are converging simultaneously: a sweeping regulatory mandate that makes heat pumps the default for new construction, a surge in homeowner replacement demand driven by aging equipment and rising energy costs, and a heat pump technology transition that is already reshaping what contractors are asked to install -and what they can charge for it. Each of these forces is significant on its own. Together, they represent a decade-long demand opportunity that will define which contractors grow and which fall behind.
The contractors who capture it will not do so by accident. This report maps where California's replacement demand is concentrated, and how the highest-growth contractors in the state are building the systems to convert that demand into predictable, high-margin revenue.
Title 24 took effect - heat pumps are now the prescriptive default for all new CA residential construction in every climate zone
Heat pump installations targeted by California by 2030. Currently ~1.9 million installed. This is a 4.1 million unit gap.
In projected energy savings from Title 24 2025 compliance over the life of the standard.
This report draws on public data from the California Energy Commission, Bureau of Labor Statistics, US Census Bureau, CSLB, and industry research to give California HVAC contractors the market intelligence they need to make better decisions about where to compete, what to install, and how to grow. While the market is flooded with low-margin repair calls, this report focuses on the $10,250 average heat pump installation in California and the business infrastructure required to close it consistently.
Key Findings
HVAC businesses in California - more than any other state
HVAC workers employed in California (BLS, 2024)
Heat pump installations targeted by California by 2030
Average heat pump installation in California

The Regulatory Landscape
For California HVAC contractors, 2026 is not business as usual. New state building codes, air district rules, and federal incentive programs have fundamentally changed the regulatory environment and with it, what homeowners are being told they need, what they're eligible to receive rebates for, and what contractors are legally permitted to install.
Title 24: The Heat Pump Mandate
California's 2025 Building Energy Efficiency Standards, commonly called Title 24, took effect January 1, 2026. The core change for HVAC contractors:
Heat pumps are now the prescriptive default for space heating and water heating in all new residential construction across all California climate zones
Gas furnaces are not banned - but any new construction project using gas must now run a performance compliance model, adding cost and complexity that most builders will avoid
End-of-life commercial rooftop HVAC units must be replaced with high-efficiency systems, which the code defines to include heat pumps
Bay Area air quality districts go further: Starting January 1, 2029, broken residential gas furnaces cannot be replaced with new gas units within the Bay Area Air Quality Management District (BAAQMD). New installations must meet zero-NOx emission standards, effectively making electric heat pumps the only compliant replacement option.
Note: Existing gas furnaces can legally be repaired and maintained to extend their lifespans. The zero-NOx point-of-sale rule strictly applies to the nine counties within BAAQMD jurisdiction: Alameda, Contra Costa, Marin, Napa, San Francisco, San Mateo, Santa Clara, Solano, and Sonoma. Contractors operating across county lines should be prepared for mixed jurisdictional codes.
The practical effect: new construction demand for heat pump installation is already accelerating. Replacement demand will compound this over the next 3-5 years as older equipment reaches end of life in a regulatory environment that steers homeowners toward electrification.

Available Incentive Programs
Regulatory mandates create demand, but the overlapping federal and state incentive programs that made heat pump installations an easy sell through 2025 are no longer fully available. Today, making a heat pump installation actionable requires contractors to sell the value of long-term efficiency, home comfort, and protection against rising natural gas rates.
TECH Clean California
Historically, the statewide rebate program for heat pumps covered all major California utilities, paying rebates directly to contractors to reduce project costs at the point of sale. However, as of early 2026, the primary state and federal incentive pools are effectively exhausted or waitlisted, leaving local utilities like SMUD to fill the gap.
Territory | Heat Pump HVAC (Retrofit) | Heat Pump Water Heater | 2026 Status / Notes |
|---|---|---|---|
SMUD (Sacramento) | Up to $3,000 | Up to $4,000 | SMUD recently boosted their own local rebates to offset the state's funding gap. |
PG&E (NorCal) | Fully Reserved | Fully Reserved | HVAC funds are exhausted.* |
SCE (SoCal) | Fully Reserved | Fully Reserved | HVAC funds are exhausted.* |
SDG&E | Fully Reserved | Fully Reserved | HVAC funds are exhausted.* |
HEEHRA / HEAR rebates | Waitlisted | Waitlisted | Waitlisted projects are only eligible for a HEEHRA rebate if they are installed after the reservation is approved. |
Table 1. Sources: TECH Clean California; SMUD
*As of April 2026.
Federal IRA Incentives
Former 25C tax credit:The 25C credit, which previously covered 30% of air-source heat pump installation costs up to $2,000, officially expired on December 31, 2025, and is zeroed out for any new installations in 2026.
Multi-year pipeline strategy: With the early termination of the 25C credit by the 119th Congress, contractors can no longer rely on federal air-source tax credits for multi-year pipeline confidence; sales pitches must now pivot heavily toward state-specific HOMES rebates, local utility incentives when available, and direct ROI from energy savings.
Where California's HVAC Demand Is Concentrated
Mapping HVAC replacement demand across California's metro areas requires combining several independent signals - housing stock age, technician employment concentration, heat pump adoption by utility territory, and seasonal climate patterns. Individually, each is a proxy; together they paint a consistent picture of where replacement volume is largest and where it is still emerging.
The Replacement TAM: Housing Stock Age by Metro
The strongest predictor of near-term replacement demand is housing stock age. The average HVAC system lifespan is 15-20 years (DOE). Homes built before 1990 have systems that are statistically at or past the replacement threshold. California has approximately 14.9 million housing units - roughly 69.5% were built before 1990.
Metro Area | Built Before 1990 | Replacement Pressure | Key Driver |
|---|---|---|---|
Los Angeles-Long Beach-Anaheim | 78.80% | Very High | Dense aging stock; high renter-to-owner conversion driving upgrades |
San Francisco-Oakland-Fremont | 76.10% | Very High | Oldest stock in state; Bay Area gas ban from 2029 adds urgency |
Inland Empire (Riverside-San Bernardino-Ontario) | 56.40% | High | Rapid population growth + extreme summer heat events |
Sacramento-Roseville-Folsom | 59.30% | High | Strong TECH Clean CA adoption; policy-forward homeowner base |
San Diego-Chula Vista-Carlsbad | 66.50% | High | Year-round cooling demand; lower urgency than inland markets |
Fresno Metro | 58.20% | High | Extreme heat events; incentives critical to close at these income levels |
Bakersfield-Delano | 55.60% | High | Extreme heat events; incentives critical to close at these income levels |
Table 2. Source: Census Reporter

HVAC Employment by Metro: A Demand Proxy
Where HVAC contractors are hiring most aggressively maps reliably to where market demand is growing. BLS Occupational Employment Statistics track technician employment at the metro level. California's five largest HVAC employment concentrations align closely with its largest replacement demand markets:
Metro Area | HVAC Technicians Employed (2024) | Share of CA Total (2024) | YoY Trend |
|---|---|---|---|
Los Angeles – Long Beach – Anaheim | 9,420 | 28% | Growing |
San Francisco – Oakland – Hayward | 3,610 | 11% | Declining |
Inland Empire (Riverside-San Bernardino-Ontario) | 5,380 | 16% | Declining |
San Diego-Chula Vista-Carlsbad | 2,810 | 8% | Declining |
Sacramento-Roseville-Folsom | 3,030 | 9% | Declining |
Bakersfield – Delano | 780 | 2% | Stable/Growing |
Table 3. Source: BLS Occupational Employment and Wage Statistics (OEWS)
Employment figures are estimates rounded to the nearest 100.
Heat Pump Adoption by Utility Territory
TECH Clean California publicly reports rebate redemption data by utility territory - the most direct measure of actual heat pump installation activity in the state. The adoption pattern reveals which markets are already in the heat pump transition and which contractors are selling into an educated homeowner base versus an early-awareness one.
Utility Territory | Service Area | Program Status | Adoption Profile |
|---|---|---|---|
PG&E | Northern and Central CA: 16M customers | Fully Reserved | Highest adoption statewide; Bay Area leads in heat pump awareness and demand |
SCE | Southern CA (ex. San Diego): 15M customers | Fully Reserved | Large market; adoption growing rapidly in Inland Empire and LA suburbs |
SDG&E | San Diego County: 3.6M customers | Fully Reserved | Smaller territory; high-income base drives strong premium system uptake |
SMUD | Sacramento area: Most of Sacramento County and small adjoining portions of Placer and Yolo Counties; about 900 square miles | Active | Punches above its weight; Sacramento is the state's bellwether electrification market |
Table 4. Source: TECH Clean California; Bluetti; California Fire Foundation; SDG&E; SMUD
Adoption profiles based on program participation data and utility-published reports.

When Demand Peaks: California's Seasonal Pattern
California's HVAC replacement demand differs from national patterns. Unlike cold-weather states where furnace failures drive winter demand, California peaks are cooling-driven - with a spring preparation season and heat-event-triggered emergency replacements in summer.
Period | Demand Type | Primary Markets | Contractor Implication |
|---|---|---|---|
March – May | Planned replacement - pre-season | Statewide | Highest opportunity window. Homeowners act before heat arrives. Best time for proactive outreach. |
June – August | Emergency replacement | Central Valley, Inland Empire | Heat events trigger failures. Fastest close rate but capacity-constrained. Premium pricing justified. |
September – October | Post-peak planned replacement | Bay Area, Sacramento | Homeowners who deferred spring act now. Heat pump upsell easier - they lived through the summer. |
November – February | Low season (Northern CA) | SoCal and San Diego year-round | Northern CA demand drops. Southern CA remains active. Strong window for maintenance contract outreach. |
Table 5. Note: California experienced significant heat events in summer 2024, affecting the Central Valley and Inland Empire, driving above-average emergency replacement volume in those markets.
What Homeowners Are Paying
Pricing intelligence is one of the most actionable data points a contractor can have. Knowing what homeowners have been told to expect shapes how contractors position their bids, how they talk about value, and how they respond when a homeowner says they got a lower quote.
The following cost data is drawn from Fixr.com's published HVAC cost guides - the same pages California homeowners read before they call a contractor. These are the reference points homeowners arrive with.
National Cost Benchmarks
These national figures from Fixr.com cost guides establish the baseline. California installations consistently run above these figures - the California premium analysis follows.
System Type | National Avg. Low | National Avg. High | National Average |
|---|---|---|---|
Heat Pump (Full System) | $5,000 | $15,000 | $8,350 |
Ductless Mini-Split | $2,000 | $8,000 | $4,400 |
Central Air Conditioner | $5,000 | $12,000 | $6,000 |
Gas Furnace | $3,800 | $10,000 | $$7,000 |
Table 6. Source: Fixr.com cost guides
The California Cost Premium
California homeowners should expect to pay 15-30% above national averages for HVAC installation. This premium is driven by three compounding factors:
Labor costs: California HVAC technicians earn a median wage of $31.39/hour vs. $28.75 /hour nationally - a 9.2% premium that flows directly into installation cost.
Permit requirements: California's building code enforcement is among the most rigorous in the nation. Permit costs for HVAC replacement depend on the county, with inspection requirements adding 1-2 days to most jobs
Equipment specifications: Title 24 minimum efficiency requirements exceed federal minimums, pushing contractors toward higher-tier equipment with longer lead times and higher unit costs
System Type | National Average | CA Premium | CA Estimated Range |
|---|---|---|---|
Heat Pump (Full System) | $8,350 | +15% to +30% | $9,600 to $10,900 |
Ductless Mini-Split | $4,400 | +15% to +30% | $5,000 to $5,700 |
Central Air Conditioner | $6,000 | +15% to +30% | $6,900 to $7,800 |
Gas Furnace | $7,000 | +15% to +30% | $8,050 to $9,100 |
Table 7. Source: Fixr.com cost guides

Note: While the California average sits at $10,250, contractors in high-cost coastal metros frequently see invoices exceeding $14,000 for basic heat pump replacements due to localized labor and compliance overhead.
The Competitive Landscape
California is the most competitive HVAC market in the United States by sheer number of businesses. Understanding the competitive dynamics, competitors, how most businesses are structured, and where the industry is headed is essential context for any growth strategy.
The Numbers
Active HVAC businesses in California - #1 in the nation
HVAC technicians employed in California - #2 behind Florida
Unfilled HVAC technician positions nationwide - a critical labor constraint
The Failure Rate Reality
The California HVAC market is large but it is also unforgiving. According to industry research, failure rates for new HVAC and specialty trade businesses have been reported as high as 70% in the first year, and BLS data confirms that fewer than half of all construction-related businesses survive to the five-year mark. The reasons are consistent: insufficient lead flow, poor customer retention, and failure to invest in marketing during the early growth phase.
Most new HVAC businesses don't survive year one
The contractors who survive are those with reliable, consistent lead sources - not one-off marketing efforts.

The implication for established contractors: the competitive churn creates opportunity. Homeowners whose previous contractor shut down are actively looking for a replacement relationship. Contractors with a strong marketing infrastructure are positioned to capture those homeowners.
The Technician Shortage
The 110,000-technician shortage is not a future problem - it is already limiting growth for contractors who have the customer demand but not the labor to fulfill it. The shortage is driven by three factors:
An aging technician workforce with significant retirements expected through 2030.
Insufficient enrollment in HVAC trade programs relative to projected demand.
The heat pump transition requires technicians to be retrained on new equipment - many experienced HVAC techs are gas-first specialists.
For contractors who are investing in technician training and retention, the shortage is a competitive advantage. Well-staffed shops can take on more jobs than their competitors, command better pricing, and deliver faster service - all of which drive customer lifetime value.

Growth Projections
Metric | Current | Projection |
|---|---|---|
HVAC job growth (nationwide) | Baseline | +8% |
U.S. HVAC services market | $18.98B (2026) | ~25.35B (2031) |
U.S. heat pump market | $16B (2025) | ~$34.8B (2034)2034) |
CA heat pump installations | ~1.9M homes | 6M target by 2030 |
Table 8. Sources: BLS Occupational Outlook Handbook, Mordor Intelligence, IMARC Group, Calmatters.org
The Heat Pump Opportunity
The heat pump transition is the most significant structural shift in the residential HVAC industry in decades. For California contractors, it is both a mandate to adapt and a significant margin opportunity for those who move first.
Heat Pumps Are Already Outselling Gas Furnaces
The transition is not projected - it is already underway:
Heat pump unit sales have grown 50% over the past 10 years; gas furnace sales have grown 10% over the same period
The U.S. heat pump market reached $16 billion in 2025 and is estimated to grow to 34.8 billion by 2034.
Heat pump shipments have surpassed gas furnace shipments, accounting for 12% more units in 2025.
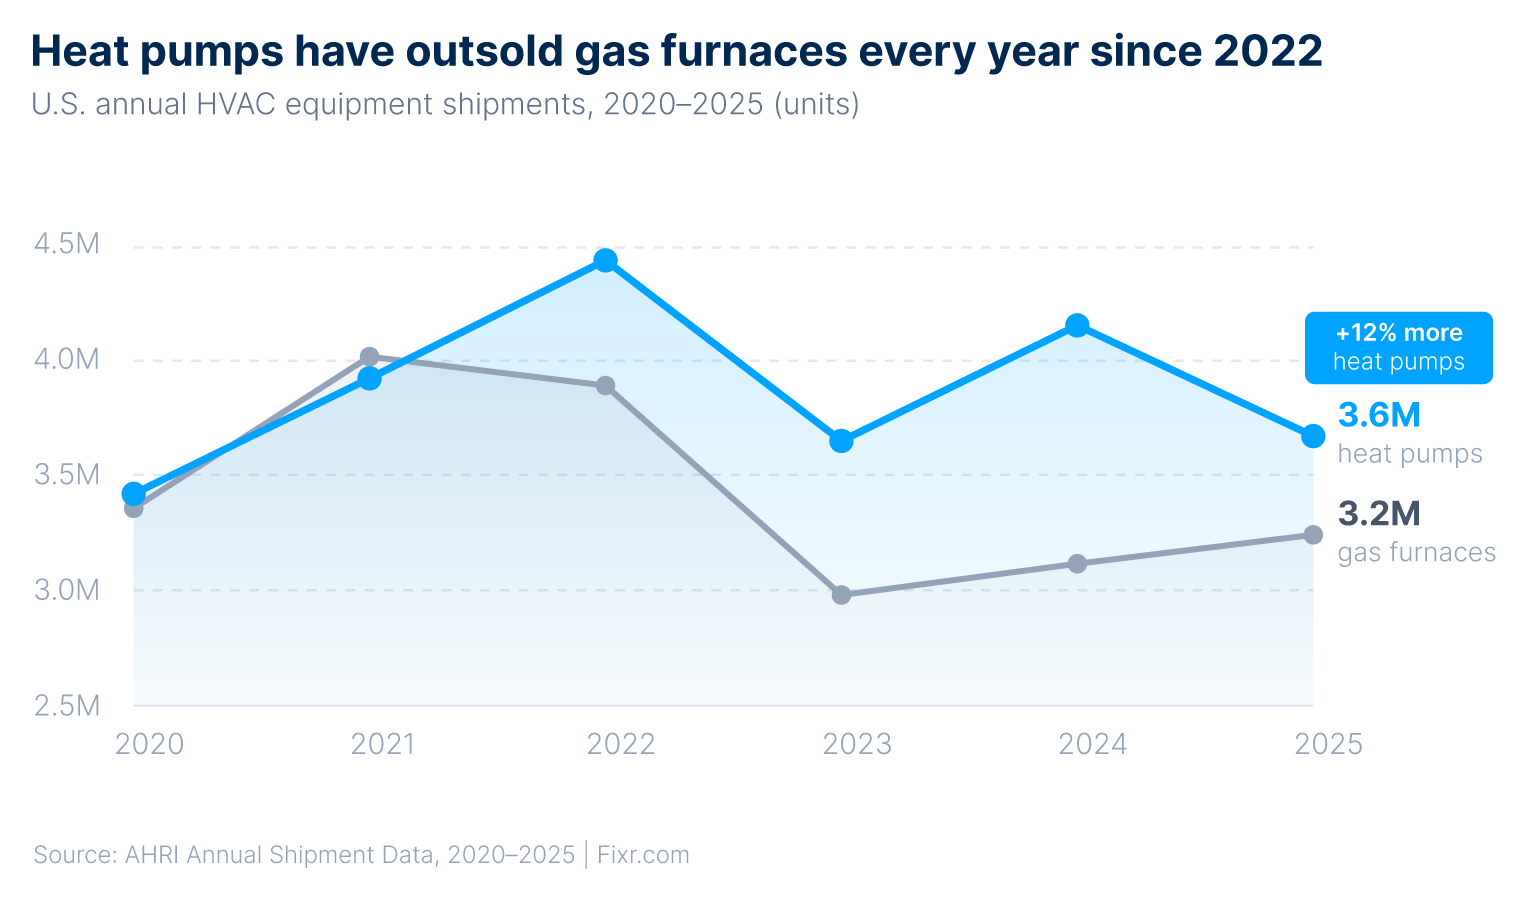 Chart 1. Sources: AHRI
Why Heat Pumps Are Better for Contractor Margins
Higher average ticket: $10,250 average installation vs. $7,350 for gas furnace replacement - 39% more revenue per job
More complex installation: requires electrical work, refrigerant certification, and load calculations - higher skill barriers reduce price competition from low-end operators
Rebate processing capability: contractors certified through TECH Clean California can process rebates at the point of sale, which uncertified competitors cannot offer
Higher service contract value: heat pumps require annual maintenance on both heating and cooling functions, vs. seasonal-only service for single-function systems
Growth Playbook for Contractors: Building the Infrastructure to Close It
California's replacement demand is large enough to support multiple business models. The contractors capturing the most revenue in 2026 are not choosing between repair work and replacement work - they are building systems around both, with different lead strategies for each.
Play 1: The Planned Replacement Model
Filling the calendar with high-margin, predictable installation work
Replacement-intent leads - homeowners who have already researched their project, used a cost calculator, and verified their contact information - represent the highest-margin job type in the California HVAC market. A planned replacement lead arrives pre-educated. The homeowner is not asking what a heat pump costs. They are asking when you can install it.
Why the planned replacement model works:
Technician efficiency: An installation crew on a planned replacement lead is working toward a $10,250 ticket from the first hour on site. A repair tech may spend the same time diagnosing a fault that resolves for $200.
Shorter sales cycle: Homeowners who arrive having used a cost guide have already crossed the research threshold. Closing time is shorter and price objections are fewer.
Predictable pipeline: Replacement-intent leads can be scheduled weeks in advance, keeping high-skill installers productive through shoulder seasons - the March–May pre-season window and the September–October post-peak period that the data identifies as the highest planned-replacement demand periods in California.
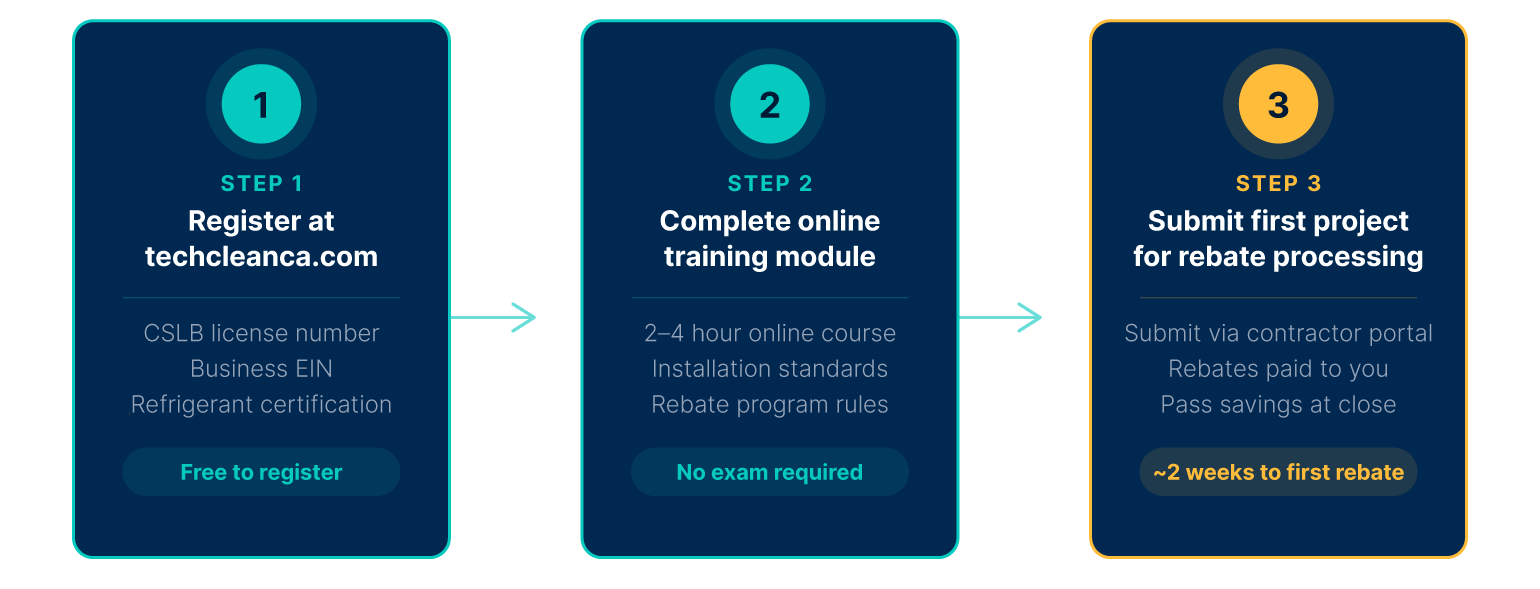
3 STEPS TO TECH CLEAN CERTIFICATION
Get certified. Process rebates at point of sale. Close higher-ticket jobs.
Play 2: The Service-to-Replacement Pipeline
Converting emergency calls into long-term replacement revenue
In the Central Valley and Inland Empire, where summer heat events drive acute, same-day demand, the emergency repair call is often the primary entry point for a homeowner relationship. A technician who provides an honest assessment during a no-cool event - identifying aging equipment, explaining Title 24 implications, and laying out the replacement economics - earns the trust required to close a high-ticket installation when the homeowner is ready to act.
Why the service-to-replacement model works:
Trust as a sales asset: Emergency calls create a low-friction first transaction. Contractors who handle them well become the first call when the homeowner decides to replace - often within the same season.
Aging stock identification: California's pre-1990 housing stock means technicians are regularly servicing systems that are statistically at or past the replacement threshold. Every repair call on an aging system is a replacement conversation waiting to happen.
Pipeline from contractor churn: In a market where the failure rate for new HVAC businesses is as high as 70%, a significant number of homeowners are actively looking for a new contractor relationship. Service calls are how established contractors get in front of them.
The Hybrid Strategy
The most resilient California contractors don't choose between repair leads and replacement leads - they use both. Replacement leads fill the schedule with high-margin, planned work. Service calls build the long-term pipeline. Together, they create a business that is neither dependent on a single lead source nor exposed to the volatility of any one demand cycle.
About Fixr.com
Fixr.com is a homeowner cost intelligence platform. We help millions of U.S. homeowners understand the real cost of home improvement projects - before they call a contractor. Our cost guides, project calculators, and expert content reach homeowners at the exact moment they're researching their next project.
Our HVAC content covers the full replacement decision: system types, cost ranges, efficiency ratings, rebate programs, and how to evaluate contractor quotes. When a homeowner has read the Fixr guide for their project, they arrive at the contractor conversation better informed and closer to a decision.
How the Fixr.com Lead Is Different
Most lead platforms sell contact info. Fixr.com delivers homeowners who have already priced their project and verified their intent at every step of the process.
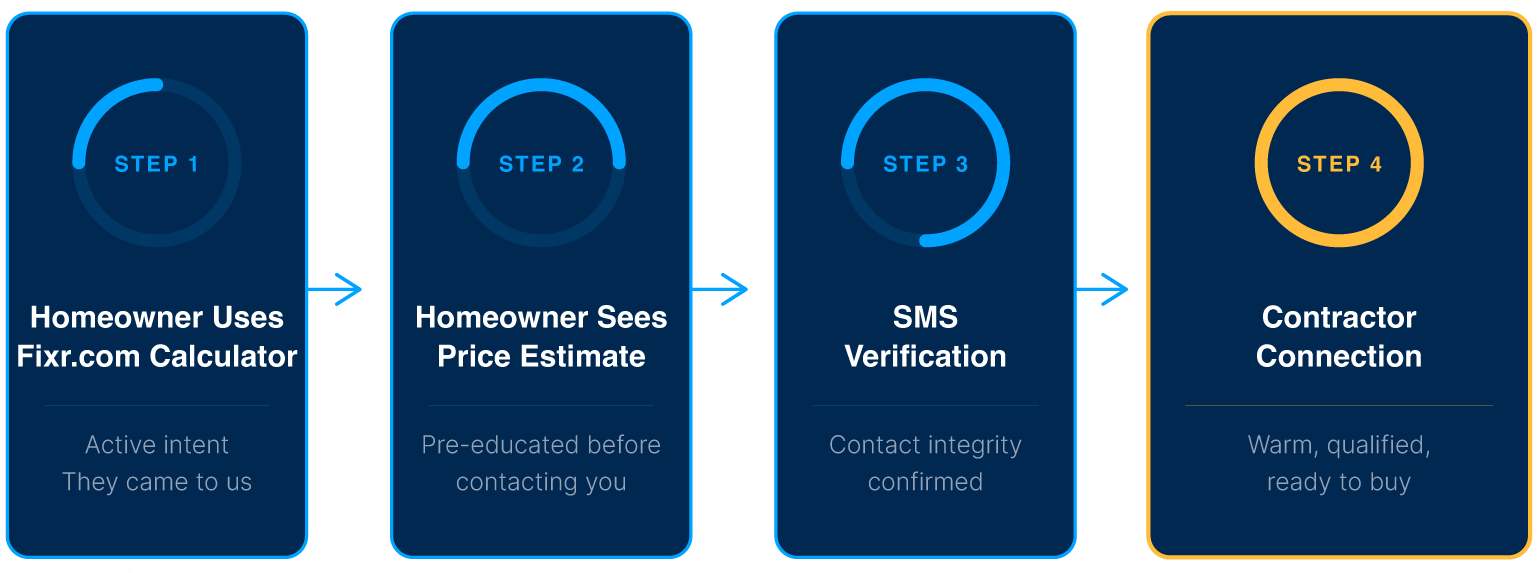
The result: every contractor connection through Fixr.com is with a homeowner who has demonstrated genuine project intent, knows what the job should cost on average, and has provided verified contact information. This is not a random inquiry - it is a buyer who has done their homework.
Get Connected with California Homeowners
Methodology
All cost figures are estimates representing averages or ranges. Actual project costs vary by home size, equipment selection, local labor rates, permit costs, and site conditions.
California average heat pump installation cost (~$10,250) is derived from Fixr's national average of $8,350 adjusted for the report's estimated 15–30% California cost premium (midpoint: +22.6%)
Rebate and incentive figures are current as of the report publication date. Programs are subject to funding availability and eligibility changes - verify details before quoting homeowners.
Table 2: The percentage data were calculated by adding up the percentages of homes built each year before 1990 across the analyzed California metro areas.
Table 3: We gathered the latest (2024) data on HVAC technicians employed in the analyzed California metro areas from the BLS Occupational Employment and Wage Statistics (OEWS). We also calculated each metro area’s share of total HVAC technicians employed in California. Employment figures are estimates rounded to the nearest 100.
Table 7: We used national average project costs from Fixr.com and applied a 15%–30% premium to estimate California cost ranges. These are directional estimates, not precise calculations.
We gathered data on heat pump and gas furnace shipments by year from AHRI annual reports. We analyzed the 10-year percentage change for both types of equipment, as well as the percentage difference between them in the most recent year reported (2025). We also calculated the share of total equipment shipments in 2025 represented by gas furnaces.