
As mid-year 2018 approaches, we've developed a three-in-one infographic complete with both historical and current data about what is happening in the world of remodeling. The above infographic provides insight to the trends in the remodeling industry, including homeowners needs and desires, as well as the most sought-after home remodeling projects.
Remodeling Data: Spend, Reasons, and Projects
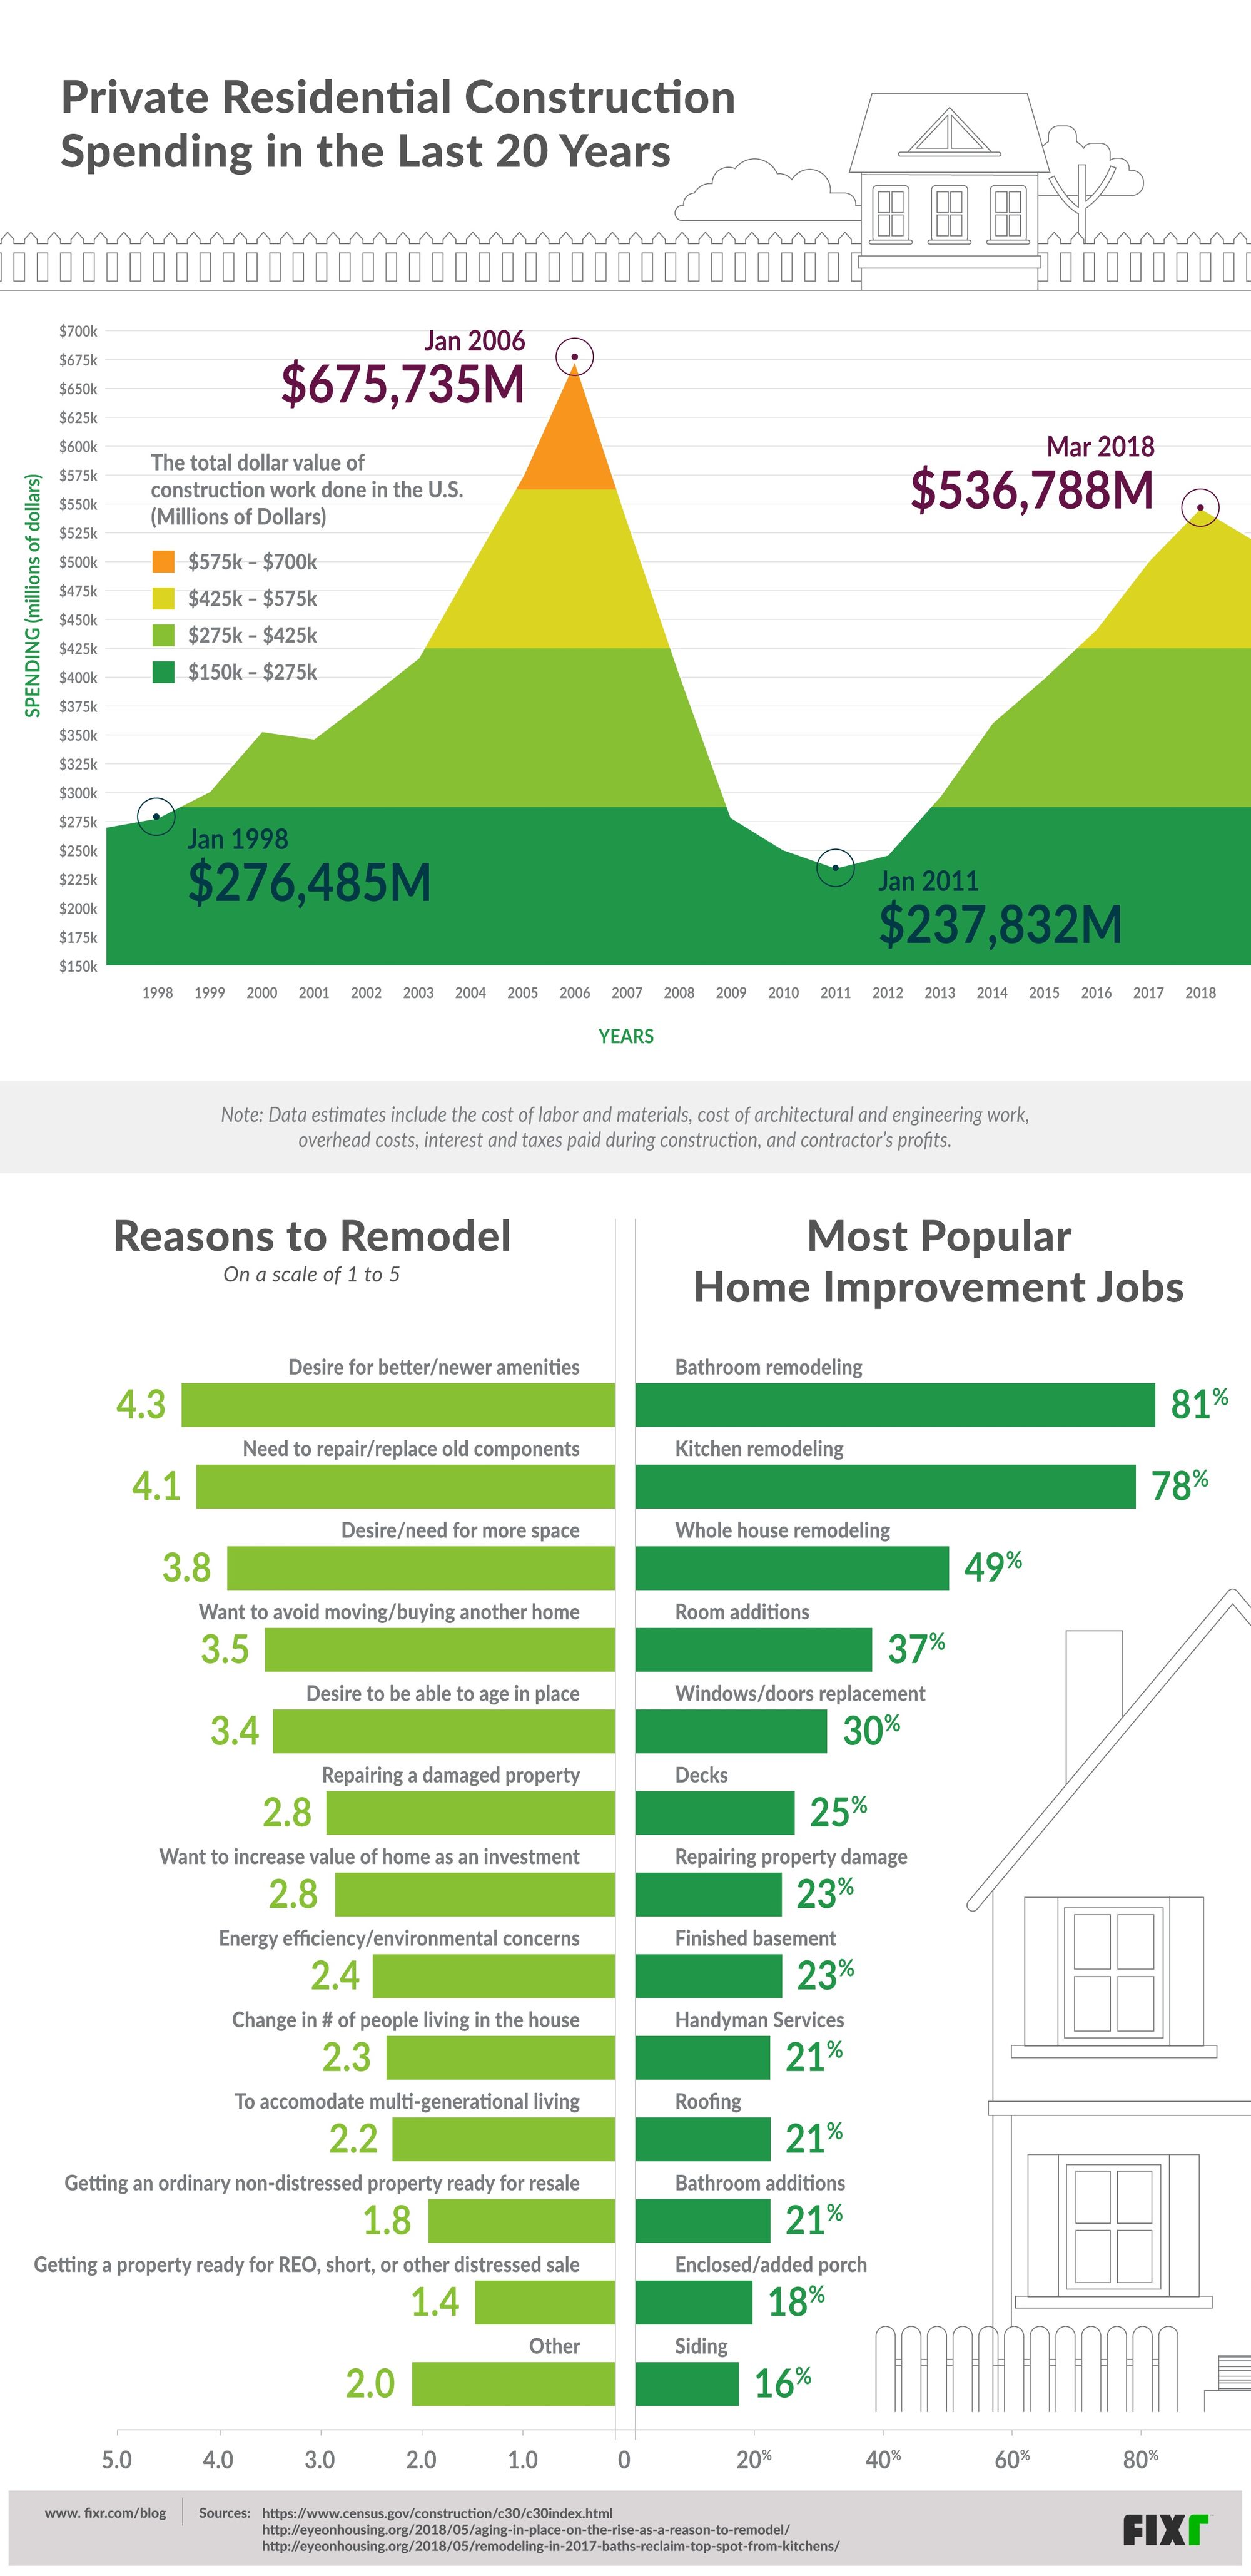
The US Census data on total private residential home construction spending is shown above in the infographic. The figures represent the total dollar value of construction work done on new structures or improvements to existing structures for private sectors.
The spending trend is quite clear with a steady increase of spending between January 1998 and February 2006, reaching a height of monthly spend at $677,984. Between March 2006 and July 2007, spending decreased an average of 1.8% each month. Beginning August 2007 until May 2009, monthly spend decreased more steeply, by 3.4% each month on average. Spending was fairly level between May 2009 and November 2010 when it began its gradual increase with a monthly spend of $234,250 ultimately reaching March 2018 levels of $536,788 monthly spend.
In the lower left of the infographic, data from an NAHB survey conducted in the first quarter of 2018 which asked respondents to rate the most common reasons for home improvement jobs is displayed. The ratings assigned each reason are the averages based on a 1 to 5 rating scale with with 1 being "Almost Never" and 5 being "Very Often". Averaging a rating of 4.3 and 4.1 respectively are the Desire for better / newer amenities and the Need to repair / replace old components. Rounding out the top five reasons, which all score over 3, are the Desire / need for more space (3.8), Wanting to avoid moving / buying a new home (3.5), and Desire to be able to age in place (3.4). The NAHB provides a breakdown on the trends of this survey, noting that the top two reasons remain the same since last year and that Desire / need for more space has been a gradual climb from 2012 to 2018; whereas, Wanting to avoid moving / buying a new home has experienced a steeper climb and that the strongest and most consistent growth has been the Desire to be able to age in place.
Another NAHB survey asked NAHB Remodelers to report on their most common types of remodeling projects for 2017. The results of the most common jobs are shown in the lower right of the infographic. Bathroom (81%) and Kitchen (78%) Remodeling jobs have held the number one and two spots since 2003 per historical data and continue to do so for 2017. While they vye for the top spot each year, sometimes swapping places, they are usually in close proximity to one another in terms of percentage. Whole House Remodeling (49%), Room Additions (37%), and Window or Door Replacement (30%) complete the top five most common remodeling jobs and are significantly less common than the top two.
Aging in Place is a Growing Reason to Remodel
The above infographic indicates that remodeling projects are based not only on needs and desires of homeowners, but on a combination of factors. Spend is influenced by economic factors such as depressed consumer expenditure during, and growth experienced after, recessions like that of both 1990 and 2007 which affected housing markets and homeowners' bottom lines. The cycle of spending can be easily correlated to the cycle of Bubble - Bust - Recovery.
The amount of money available to spend as well as an aging population of Baby Boomers may also dictate the reasons for, and types of, remodeling jobs sought after. For example, four of the top five reasons might be considered to be a case for the aging population. A remodeling project that allows a homeowner to age in place versus moving to a nursing or other type of retirement facility will often require the installation of newer amenities and updating of older components. In cases like these, the particular fixes and improvements are made to fulfill the needs of staying in their current home.
Many projects ranking in the Top 5 could be directly related to the remodel reason, Desire to be able to age in place. Bathroom and Kitchen remodeling and replacement of windows are just a few of the important projects to consider when making a home more accommodating to an older homeowner that may experience arthritis or limited balance. Additionally, even in a low spend period, it may be beneficial to consider updates to age in place as, on average, they cost $9,000 while a move to typical nursing home may run $50,000 per year!
Finally, although the data shows trends of the top remodeling projects, these results should be taken with a grain of salt. The survey respondents were solely NAHB remodeler contractors and did not include unlicensed contractors, DIY homeowners, and/or manufacturing companies that provide their own contracting services (such as window or door installation). Outside factors like these could have an effect on the data and should be considered when choosing a remodel project that is unique to your own personal needs, desires, reasons, and spend ability!