The cost of living has risen over recent years with electricity bills constantly increasing, while the cost to install solar panels has steadily decreased. It’s no wonder that more homeowners have started to consider solar for their homes. However, lower bills and being more environmentally friendly are not the only benefits.
In a recent study using data from real estate site Zillow, it was found that adding solar panels to homes can increase value by 6.8%. So what does this do to the average home value in your state and the return on investment for solar panels? Check out the maps below to see how much solar panels could be worth to you when it comes time to sell your home.
Analyzing Home Value With Solar

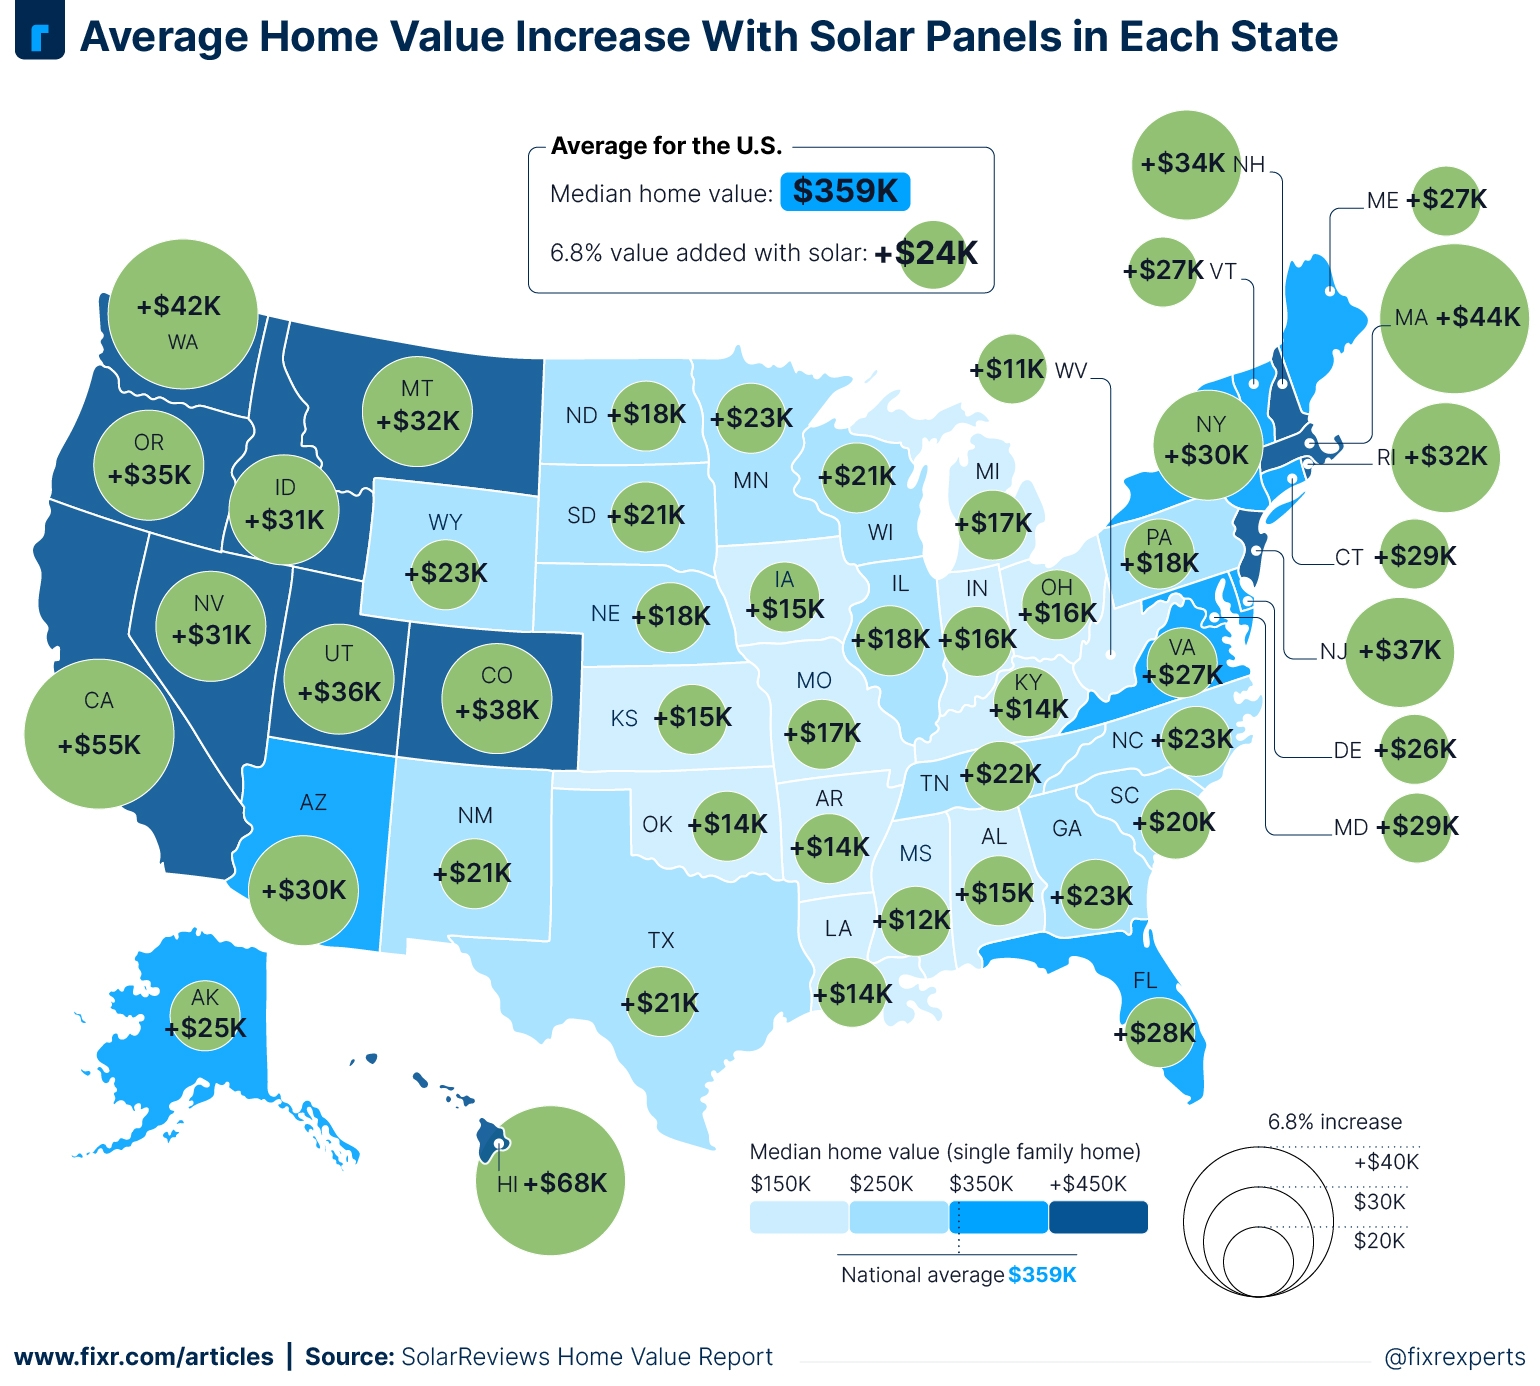
As you can see in the map above, the state that sees the most home value added with the addition of solar panels is Hawaii, increasing the average home value to a whopping $1,064,776. At the other end of the scale, we see West Virginia, which could see average home prices increase to $174,237.
The average home value according to Zillow is $358,734 meaning that a 6.8% increase due to solar panels added amounts to an extra $24,394. With solar panels costing an average of around $19,000 in 2024, that is a return on investment (ROI) of 128% when it comes time to sell your home.
Return on Investment of Solar Panels in Each State

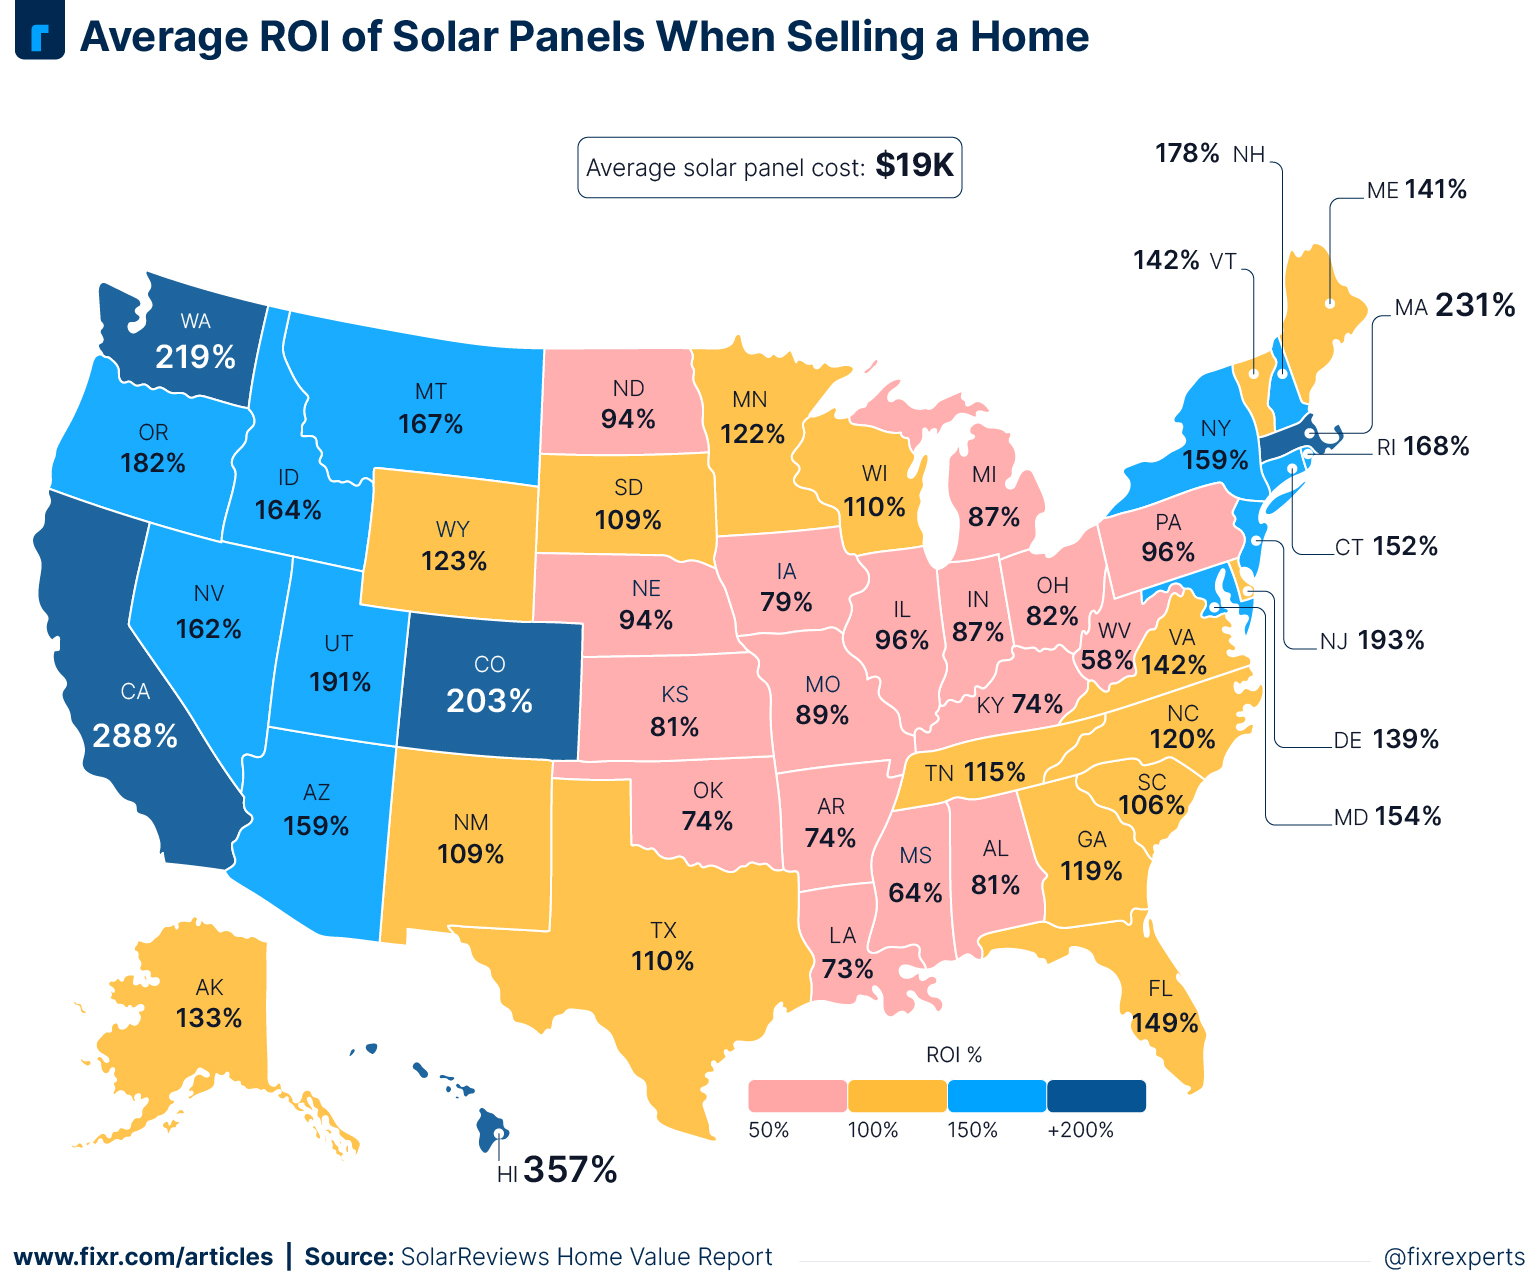
The return on investment for solar panels is completely recouped in 33 out of the 50 states according to this dataset. In a state like South Carolina, a 6.8% increase results in an added home value of 20K. If you take away the 19K cost of a solar installation, the ROI drops to 105%. In a state like Mississippi, you can only expect to recover around 64% of the cost of solar panels. However, it is worth noting that the value added to a home with solar panels is on the condition that they are fully paid for and in good working condition. It is also worth considering that the cost of installing solar panels can vary depending on where you are in the country.
Does Solar Carry the Same Value in Every State?
The simple answer is no. In this article, we are dealing with a broad average to give a general idea of the value solar panels can add across the country. However, in some areas, you are less likely to see such an increase in perceived home value after installing solar, while in others you could see even higher.
Also, when comparing homes with and without solar panels in major solar states like California and Florida, the expected added value drops to roughly 5.4%. In states such as Nebraska, adding solar might barely make any difference to home prices. Yet, Michigan homes with solar are valued at roughly 9.2% higher than those comparably without.
While the upfront cost of solar panels is a major factor, their money-saving benefits also impact how much they are worth to homeowners. If you live in an area with high utility costs, switching to solar makes them an even more worthwhile asset.
Other Factors to Consider
Home Aesthetics
While there may be fluctuations in each state, each home is also a different story. If solar panels do not tie in well with your home's curb appeal, this could negatively impact curb appeal, which, in turn, can affect home value.
How You Pay for Solar
A return on investment is easy if you pay for solar panels outright. However, this becomes more difficult if you have leased your panels. Potential homebuyers may not be keen to take on monthly payments for solar on top of their mortgage and other bills.
Solar System Size and Condition
If your system is old, and in need of repairs or renewal, you can expect the added value to your home to be minimal. Homebuyers want to invest in something that will save money on their monthly bills, not a cost burden a short while after moving in. Also, if you have a bigger system than the average 6 kilowatts, you can expect to see bigger monthly savings on electricity.
Adam Graham is a construction industry analyst at Fixr.com. He has experience writing about home construction, interior design, and real estate. He communicates with experts and journalists to make sure we provide the most up-to-date and fact-checked information. He has been featured in publications such as Better Homes and Gardens, and written for various outlets including the National Association of Realtors, and Insurance News Net Magazine.
