
Despite the current concerns for the housing market and projections that domestic construction spending is slowing, home improvement spending is up. Though not directly linked, one main driver for home improvements is a healthy housing market, and opportunities to sell/buy, so this increase in spending may come as a surprise. The results were included in The Joint Center For Housing Studies of Harvard University (JCHS) 2019 report, Improving America's Housing, looking at home improvement work carried out by homeowners in the U.S. We break down the results and analyze what those results mean for the construction industry going forward.
Remodeling Spending in 2017
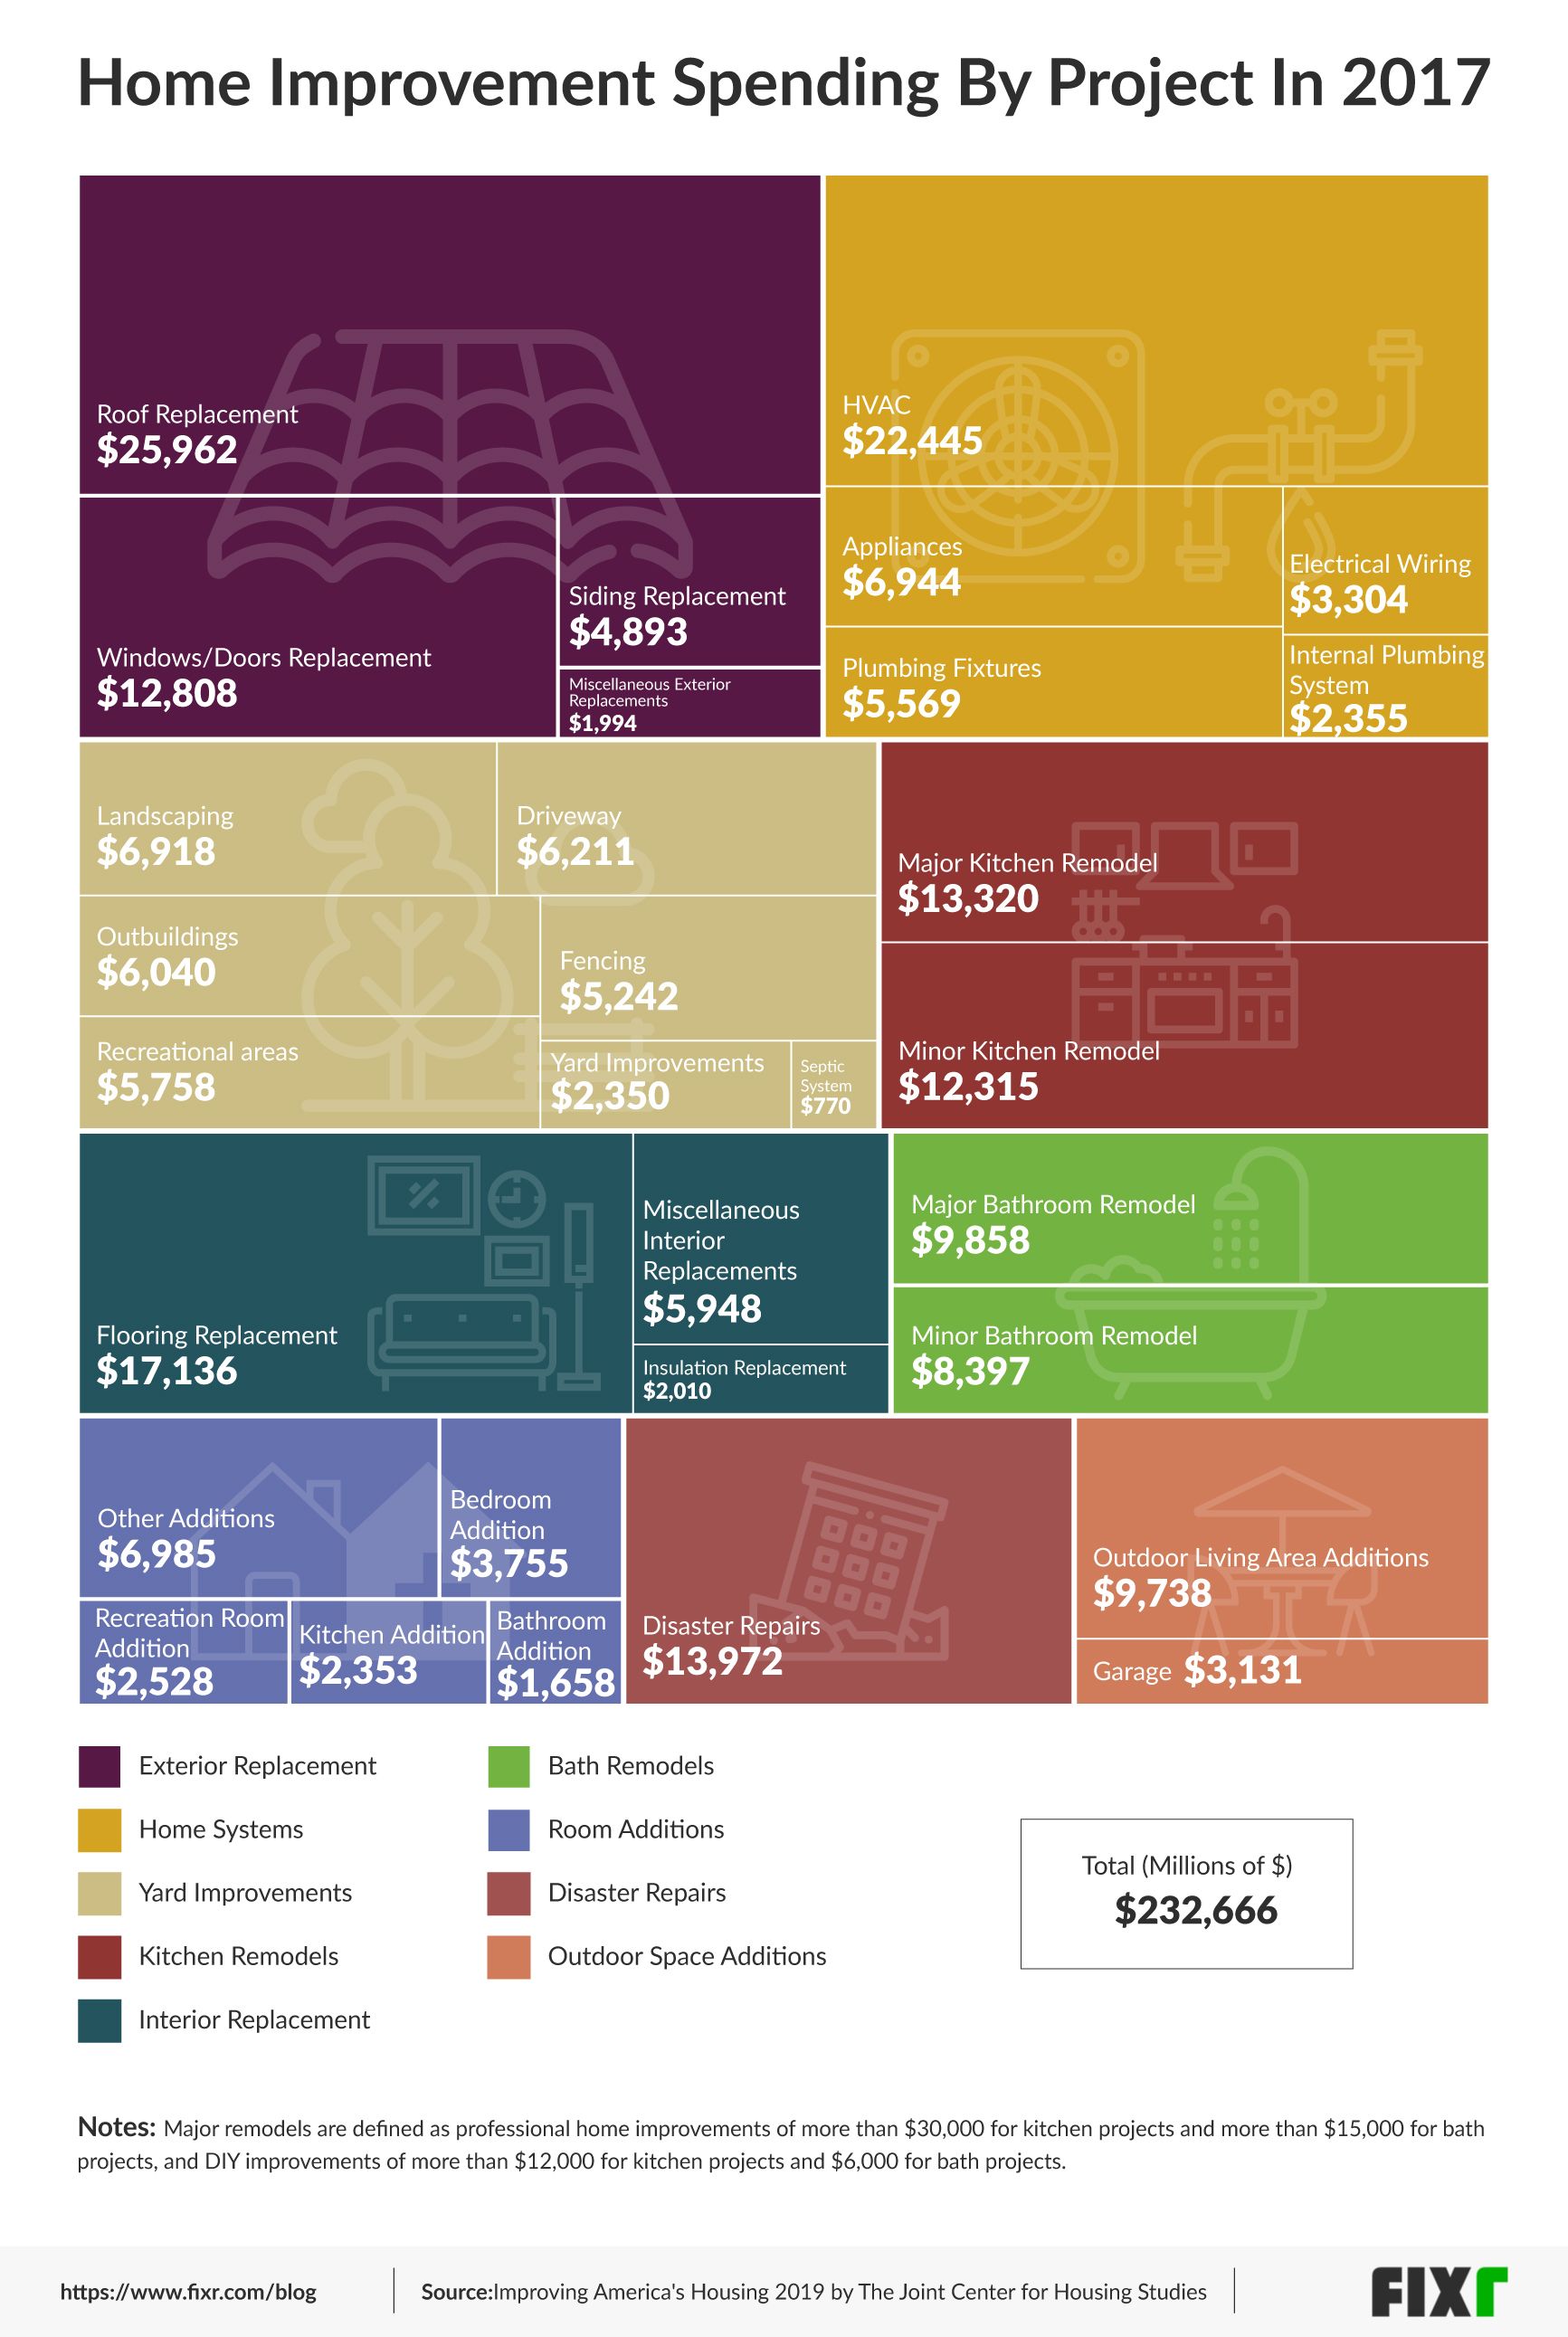
The graphic was created using data from the latest JCHS survey on American housing improvements, released in 2019, which looked at home improvements carried out by homeowners across the country for the year 2017.
The area of improvement with the greatest expenditure was exterior replacements with a total of $45,656M, followed by home systems and equipment at $40,617M and yard improvements at $32,519.
Following that, kitchen remodels came in with a total of $25,635M, interior replacements came in next at $25,094M, $18,255M was spent on bathroom remodels, room additions came in at $17,280M, disaster repairs came in at$13,972, and outdoor space additions came in last with a total of $12,869M.
Main growth areas in remodeling spending
As housing prices remain high and household mobility low, other factors must be at play to cause this increase in spending. Looking at the age of housing stock may give some ideas for these increased expenditures. According to the JCHS survey, 80% of American homes are now at least 20 years old while 40% have passed the 50-year mark. Older housing leads to an increased demand for improvements, as older components need to be replaced. This is echoed by the figures above, with interior and exterior replacements being the leading cause for expenditure. This will likely continue to be a trend, as housing stock continues to age and replacement housing is slow to go up.
Aging in place and efficiency have become the main drivers for spending
High household mobility usually indicates an increase in home improvements (spending on improvements are generally high when homeowners are planning to move). However, one of the reasons for the current low mobility rate is that homeowners are older now than they have been for some time. The JCHS survey shows that the number of homeowners aged 55 and older has leaped by 60% in the last decade. Older homeowners have less desire to move and have the income to make improvements to suit their needs in their current homes. Also, 88% of home improvement projects carried out by older homeowners, were completed by professionals, rather than as DIY projects. Again this trend is likely to continue, as younger homeowners find it hard to afford escalated housing costs, and the homeowner population continues to age.
Another thing to consider is that DIY jobs seem to be on the decline- an important point for professionals in the industry. From holding 25% of the market in 1997, expenditure on DIY has fallen to 18% in 2017. Even homeowners below 35 have chosen to go with DIY 4% less than 10 years ago.
Finally, many of the most requested improvements are related to energy-efficiency improvement and ultimately savings. As alternative energy continues to become more accessible to homeowners, and awareness of possible savings with efficiency improvements increases, this is another area that should see continued interest and spending. This includes changes to HVAC and insulation as well as all sealants in the home, such as roofing, siding, and windows, which all affect the temperature of the home. These changes have been particularly common in states with older housing stocks and colder climates.
Final thoughts on improvement figures
While the numbers are initially, potentially confusing, especially when broken down job-by-job, looking at the overview can provide some interesting insights. The construction industry always has room to grow, and innovate according to the needs of homeowners, the key is identifying these needs. By assessing the above data, it is possible to assume that replacement of structural elements, equipment and finishes are likely to be a priority in homeowner spending, along with amendments to homes to allow for aging in place, and renovations to improve efficiency. These are all areas that could require significant spending, and the construction industry can prepare accordingly. That said, these are just three areas that, it can be deduced, will continue to grow, with a little more market awareness, and analysis of trends, professionals in construction should be able to stay ahead of the curve, offering in-demand services.