
The U.S. is no stranger to all types of natural disasters, especially during the late summer period, which is why September is National Preparedness Month (NPM). A natural disaster is any catastrophic event caused by natural forces, rather than human activities, leading to significant loss of human life or extensive damage to the environment, private properties, or public infrastructure. From severe storms and tornadoes to hurricanes and flooding, year on year we witness destructive forces of nature impacting homes and communities across the nation.
In this article, we take a look at the FEMA-declared natural disasters in each state. Our interactive tool lets you see which states have been hit hardest by each type of weather event. As climate change leads to an increasingly volatile world, we find that disaster preparedness is more than just an option for those with extra resources; it needs to be an essential part of life for all of us. For this reason, we also share key tips for preparing your home for common disasters where you live.
What Are Declared Natural Disasters?
Natural disasters are a frequent occurrence across the nation. However, not all major weather incidents are ‘declared’. A declared natural disaster happens when local, state, or tribal governments need extra assistance from the federal government. The affected state’s Governor must request a Stafford Act declaration to begin the process. Once a damage assessment has taken place, there will be one of two types of declarations made: an emergency declaration or a major disaster declaration. Federal aid, relief, and recovery are then sent to the region, under the Federal Emergency Management Agency (FEMA).
Interactive Map Showing Natural Disasters Declared in Each State (1953-2023)
By default, the map will be set to total natural disasters' and the darker shades of color on the map will offer you a visual understanding of which areas of the U.S. are most disaster-prone. Texas, for instance, is a dark orange: FEMA declared 372 natural disasters between 1953 and 2023. Washington DC, the lightest shade on the map, is much less disaster-prone: just 23 incidents have been declared since 1953.
Select a disaster in the drop-down menu to see specific data for it in each state.


Breakdown of Declared Disasters
Total disasters
| State | Total disasters |
| 1. Texas | 372 |
| 2. California | 367 |
| 3. Oklahoma | 224 |
| 4. Washington | 194 |
| 5. Florida | 175 |
The total number of declared disasters includes the following incidents: Fires, floods, severe storms, snow and ice, tornadoes, tropical storms, earthquakes, and other, less common, natural disasters. Some states have witnessed a significantly higher number of natural disasters than others. Texas, California, Oklahoma, Washington, and Florida are the top 5 most affected states.
Floods
| State | Flood disasters |
| 1. Texas | 40 |
| 2. California | 40 |
| 3. Washington | 33 |
| 4. West Virginia | 32 |
| 5. North Dakota | 32 |
Texas and California are the states with the highest number of flood disaster declarations in the entire U.S., totaling 40 such incidents during the overlooked period. California experienced several flooding incidents this year, caused by storms and excessive rainfall. In August, Storm Hilary delivered 4 to 5 inches of rain to coastal areas and deposited 10 inches or more in mountainous regions. These events resulted in compulsory evacuations, power outages affecting hundreds of thousands of residences and businesses, property destruction, and tragic loss of life.
Fires
| State | Fire disasters |
| 1. California | 278 |
| 2. Texas | 258 |
| 3. Washington | 129 |
| 4. Oklahoma | 109 |
| 5. Oregon | 101 |
California and Texas stand out as the states with the highest frequency of fire incidents declared across the entire U.S., followed by Washington, Oklahoma, and Oregon. Fires are the most common natural disaster event in the U.S. Climate change has a notable influence on wildfires globally, marked by rising temperatures, prolonged droughts, and a dry atmosphere. Wildfires have destroyed a significant number of structures across the U.S., where more than 60% of the total structures destroyed were in California.
Severe storms
| State | Severe storm disasters |
| 1. Oklahoma | 47 |
| 2. Alabama | 45 |
| 3. Kansas | 39 |
| 4. Mississippi | 39 |
| 5. Tennessee | 38 |
Oklahoma and Alabama declared the most severe storms between 1953 and 2023, followed by Kansas, Mississippi, and Tennessee. This year, areas of Mississippi have experienced substantial property damage due to severe storms, straight-line winds, and tornadoes.
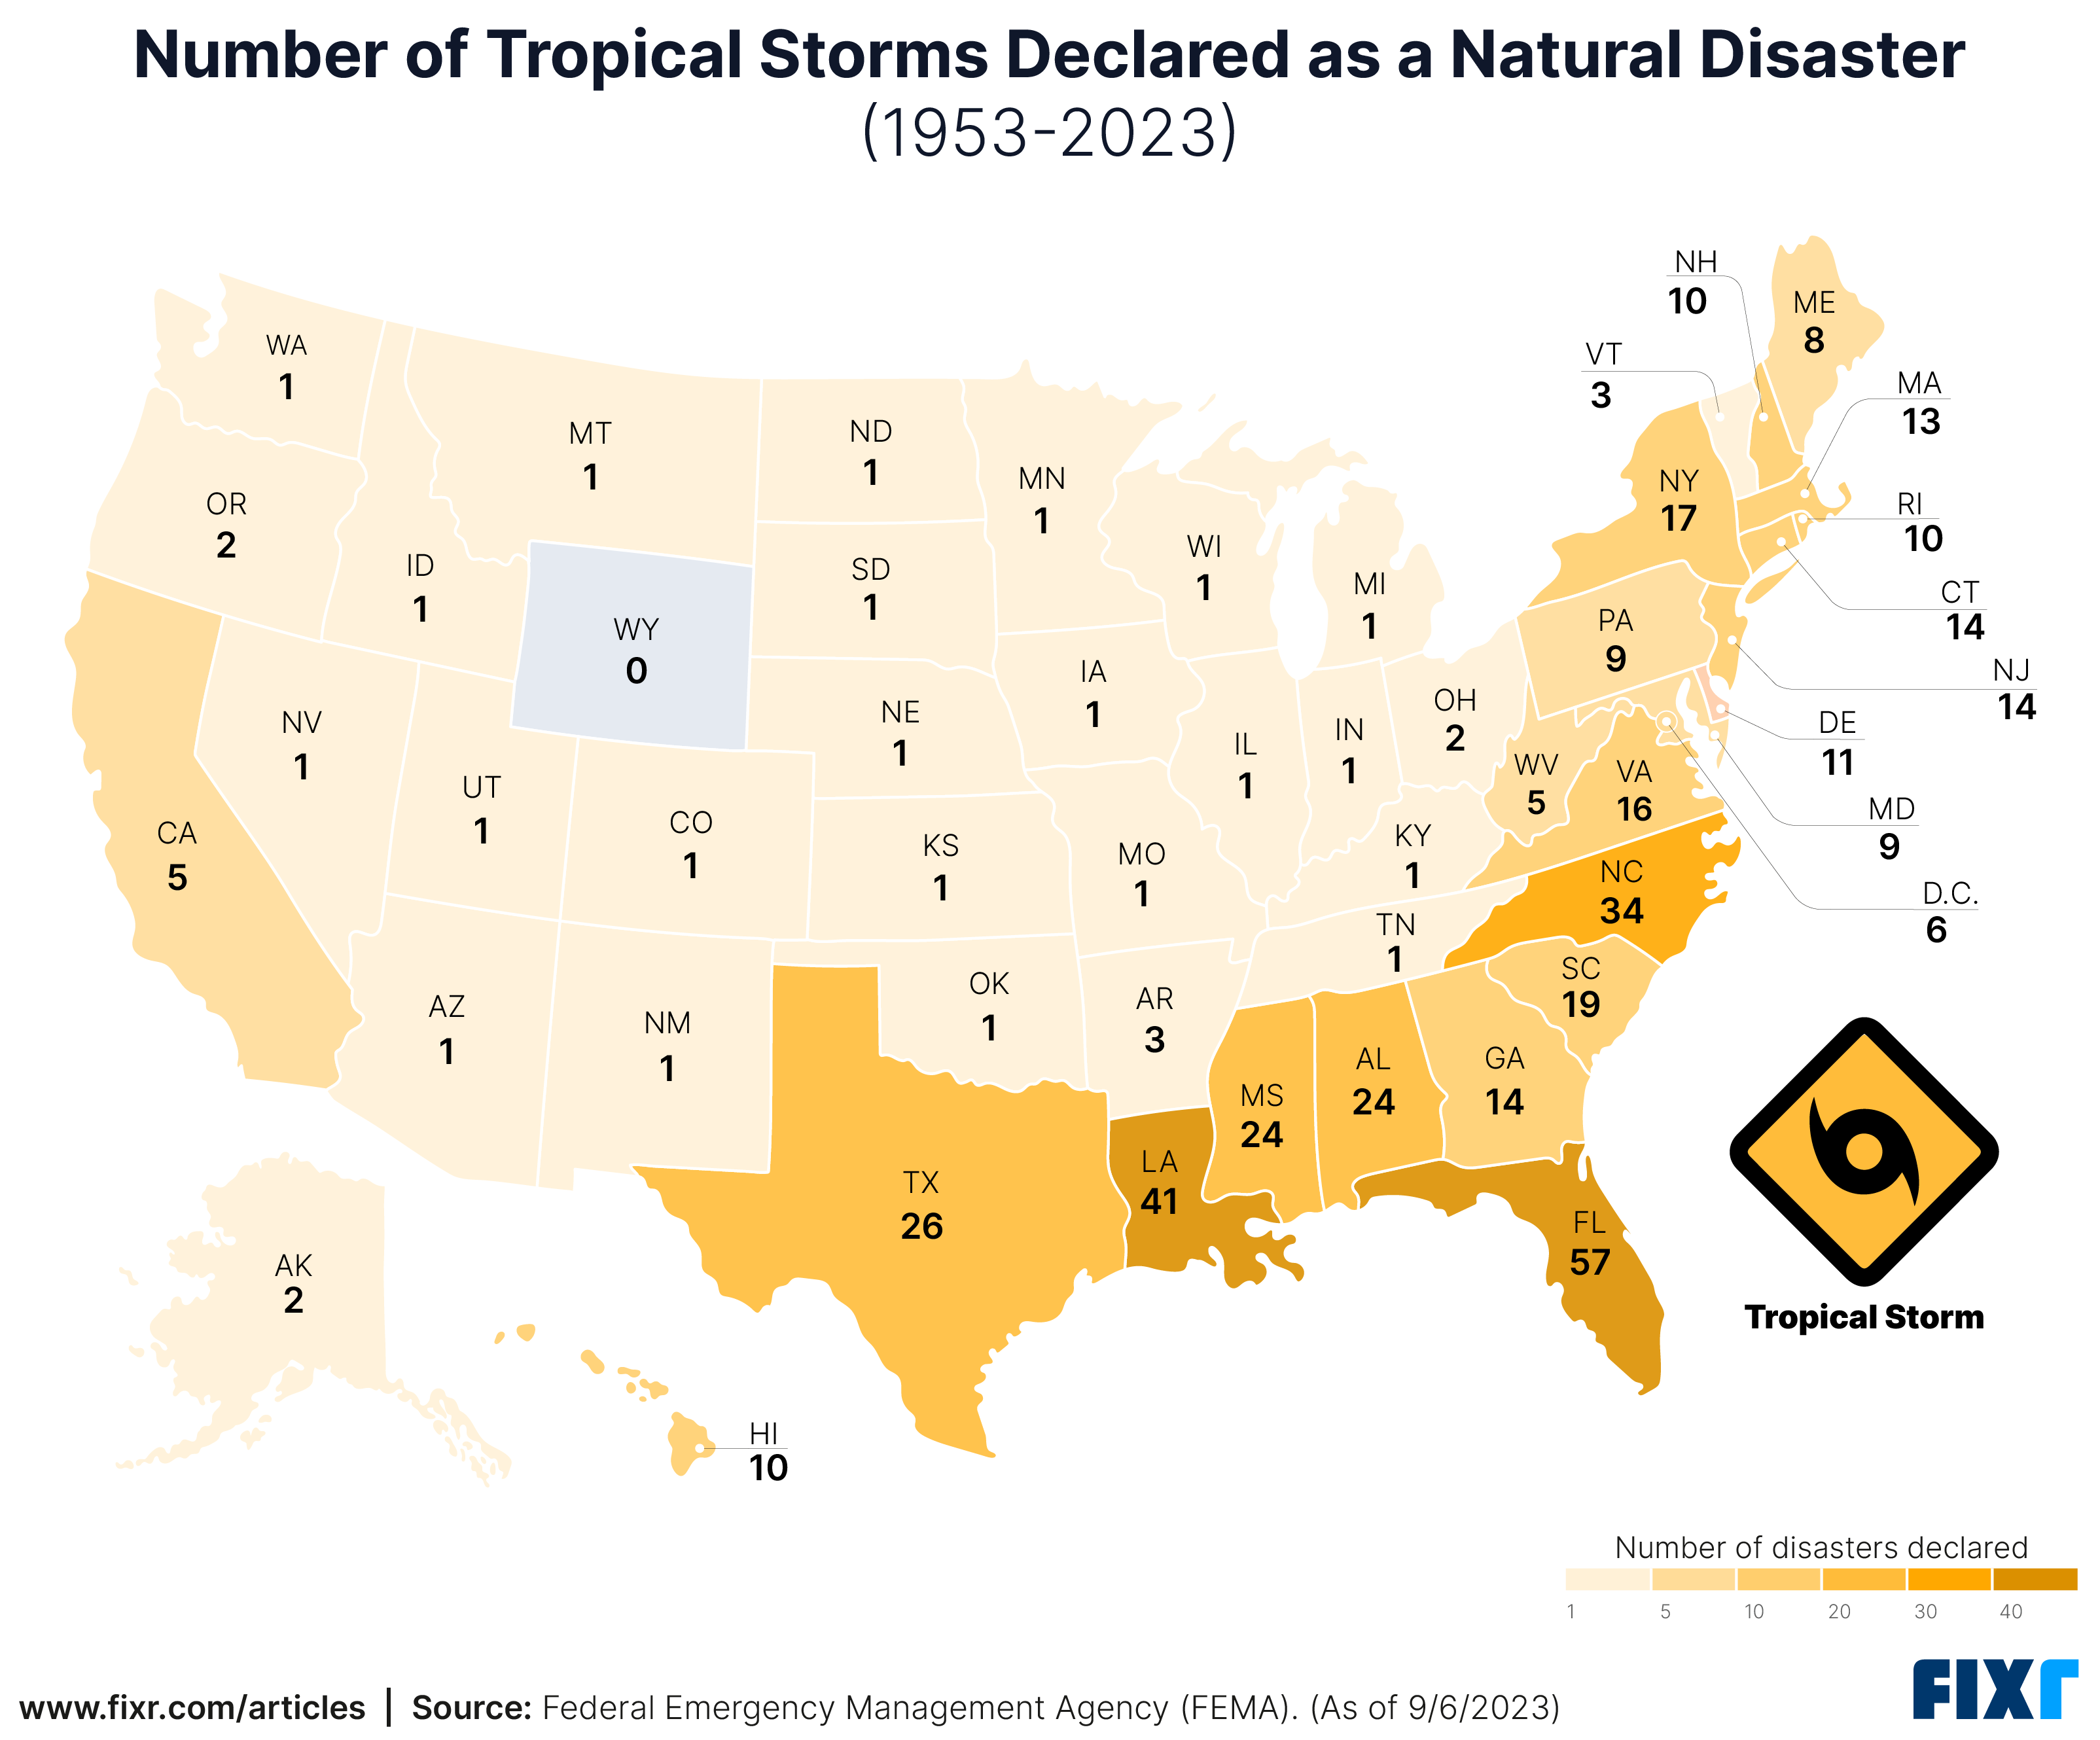
Tropical storms
| State | Tropical storm disasters |
| 1. Florida | 57 |
| 2. Louisiana | 41 |
| 3. North Carolina | 34 |
| 4. Texas | 26 |
| 5. Alabama | 24 |
Tropical storms include hurricanes, coastal storms, tsunamis, and typhoons.
Florida is the most affected state by tropical storms counting 57 disaster declarations since 1953, followed by Louisiana, North Carolina, Texas, and Alabama. In August Florida was hit by category 3 hurricane Idalia, which later moved to South Carolina and North Carolina. The hurricane season is currently running ahead of the historical average, and forecasters expect more major hurricanes than originally predicted.
Tornadoes
| State | Tornado disasters |
| 1. Arkansas | 18 |
| 2. Texas | 15 |
| 3. Georgia | 13 |
| 4. Mississippi | 12 |
| 5. Oklahoma | 12 |
Arkansas and Texas lead the number of tornadoes that have been destructive enough to attain declared natural disaster status, closely followed by Georgia, Mississippi, and Oklahoma. The first three months of 2023 saw a record-breaking number of tornadoes in the U.S. And while not all tornadoes are catastrophic, the upward trend in numbers is noteworthy. In 2023, the highest number of tornadoes has been reported in Illinois.
Snow and ice
| State | Snow and Ice disasters |
| 1. New York | 25 |
| 2. Oklahoma | 13 |
| 3. Maine | 13 |
| 4. Massachusetts | 11 |
| 5. Illinois | 9 |
Snow and ice disasters include snowstorms, ice storms, winter weather, winter storms, and freezing temperature disasters. New York is the most affected state by this type of incident, counting 25 disasters declared since 1953. This number is nearly double the number of disaster declarations in Oklahoma or Maine, the two states following closely as the next most affected.
Earthquakes
| State | Earthquake disasters |
| 1. California | 14 |
| 2. Alaska | 4 |
| 3. Hawaii | 4 |
| 4. Washington | 2 |
| 5. Oregon | 2 |
Since 1953, earthquakes have been declared natural disasters in only 11 states. California, with its earthquake count surpassing that of the next four states combined, holds the top position for the highest number. The biggest earthquake ever recorded in the United States and declared a natural disaster occurred on March 28, 1964, in Alaska, measuring a magnitude of 9.2.
Record-Breaking Billion-Dollar Natural Disasters in 2023

In the above graphic, you can see data taken from the National Centers for Environmental Information that shows natural disasters that have occurred so far in 2023. There have been a record 23 billion-dollar disasters as of August 2023, which is more than any other. The previous record was set in 2020 when there were 22 billion-dollar disasters. The graphic highlights the events and their dates, which states were affected, and how much damages cost. The most costly disaster is set to be Hurricane Idalia with an damage estimated to cost between $12 and $20 billion.
How to Prepare Your Home For Natural Disasters
Floods
Top 5 states most affected by floods: Texas, California, Washington, West Virginia, and North Dakota.
It is worth noting that while some states top others when it comes to declared disasters, other states are also prone to floods, such as Louisiana, Florida, and Mississippi, among others. If you live in any of these areas, having the following flood preparation could save you in repair costs later:
- Consider the installation of sump pumps in your basement, the addition of backflow valves to your sewage system, and securing any fuel tanks to prevent potential spills and basement contamination in the event of a flood disaster.
- Opt for flood-resistant materials like ceramic tile, vinyl, or rubber for flooring. Consider plaster, cement board, concrete, or pressure-treated, decay-resistant wood for your interior walls and ceiling. Replace wooden doors and window frames with metal.
- Ensure your home's foundation is secure by sealing cracks with mortar or hydraulic cement and waterproofing your basement walls. Install drain plugs for basement floor drains to prevent sewer backups, and consider adding flood vents to prevent water pressure buildup during floods.
- Secure items like air conditioning condensers, heat pumps, water meters, and other service equipment on platforms or pedestals raised at least one foot above the projected flood elevation.
- If you have homeowner's insurance you should know that it does not usually extend to covering floods. Consider getting additional flood insurance.
Tropical storms
Top 5 states most affected by tropical storms: Florida, Louisiana, North Carolina, Texas, and Alabama.
The above 5 states have declared most tropical storms over the past 70 years, yet other states that commonly experience tropical storms also include South Carolina, Georgia, and Mississippi. If you live in these states, consider the following tips to secure your home this storm season:
- To protect your home interior against the destructive forces of high winds and water infiltration, consider investing in hurricane shutters and storm windows.
- Swap gravel landscaping with lighter, fire-resistant materials.
- Trim weak branches and trees to prevent them from falling on your house.
- Replace your exterior doors with hurricane-proof doors with sturdy hinges and deadbolt locks.
- Replace old garage doors with wind and impact-resistant options.
- Seal wall openings using high-quality urethane-based caulk to prevent water infiltration.
- In order to reduce or potentially eliminate the expenses associated with restoring damage, it is important to have a homeowner's insurance.
Earthquakes
Top 5 states affected by earthquakes: California, Hawaii, Alaska, Oregon, and Washington.
If you live in a state that could be rocked by an earthquake at any moment, make sure you are well prepared for such an event. Follow government guidelines, which include the following:
- Ensure at least two accessible exits to ensure a safe escape in the event of an earthquake.
- Secure water heater, appliances, and other objects to prevent damage from them falling.
- Use childproof locks on drawers and cabinets to prevent content from falling out.
- Reinforce decks, porches, carports, and canopies for added safety.
- Attached garages with living space above them tend to have insufficient bracing, especially near the vehicle entrance. Incorporating extra reinforcement in the garage can mitigate swaying and the potential for collapse.
- Homeowner's insurance does not extend to covering earthquake disasters, so you should consider getting an earthquake insurance.
Fire
Top 5 states affected by fire: California, Texas, Washington, Oklahoma, and Oregon.
If you live in a state that is at risk of wildfire, make sure you are well prepared for such an event. Follow government guidelines, which include the following:
- Consider replacing your roof with a Class A-rated roofing with noncombustible coverings. Additionally, install or replace eaves with shorter overhangs and flat ledges to avoid the embers catching on them.
- Secure exterior attic vents and under-eave vents by using metal wire mesh with openings no larger than 1/8 inch to effectively block embers from entering. Additionally, consider installing a fire block in the space between the upper portion of framed walls and the foundation of your house to prevent spreading the fire.
- Use fire-resistant caulk, mortar, or fire-safe expanding foam to close any openings in the exterior walls and roof.
- To protect your home from radiant heat during a fire, consider installing multi-pane windows or tempered safety glass, which act as barriers against heat transfer. Additionally, fire-resistant shutters can provide an extra layer of defense.
- Consider installing a sprinkler system that creates a moisture barrier around your home, reducing the risk of embers igniting it.
- Home insurance usually covers wildfire damage, but in areas at high risk for wildfires, the coverage might have some restrictions.
Preparedness and Awareness
Understanding the climate where you live can help you better maintain your home. Seasonal weather changes will dictate the materials your home has and the maintenance tasks you carry out. But natural disasters can be unpredictable, and extremely costly when it comes to repairs.
Securing traditional home insurance can be difficult if you've made previous claims or live in a high-risk damage-prone area. One solution is to get a FAIR Plan (Fair Access to Insurance Requirements) that specifically covers high-risk homes.
If your home has suffered damage due to a natural disaster, you can access valuable information on the restoration process and costs through our damage recovery guides.
Author
Irena is an industry analyst at Fixr.com. She analyzes and looks for visual ways to simplify data. She has been researching and writing about home improvement and personal finance since 2018. At Fixr.com, she is constantly looking to give homeowners the best advice on how to invest in their homes.